[Recognizing simple patterns in trading] Crypto academy/S5W2 homework post for @sachin08


WHAT IS YOUR UNDERSTANDING ABOUT TRIANGLES IN TRADING. EXPLAIN ALL FORMS OF TRIANGLES IN YOUR OWN WORDS. (SCREENSHOT REQUIRED)
Triangles in trading are horizontal trading patterns represented by drawing Trendlines formed on price chart. This is usually identified whenever the bottoms and tops of a price action interacts or moves towards each other. When this happens, traders tends to anticipate breakouts. The triangle patterns in trading are the simplest technical analysis most traders are familiar with as it is way more easier for traders to recognize patterns using this tool.
This triangle pattern being a technical analysis tool depicts Its importance in spotting trends as well as being used to predict future events so as to enable traders carry out their trades more profitably. More to this is the fact that triangle patterns in trading also help traders in indicating the continuation of both a bullish and a bearish market and also spot reversal points in a chart.
3 TYPES OF TRIANGLE PATTERNS
Basically, we have 3 forms of triangles in trading which include the following:
- Ascending triangle
- Descending triangle
- Symmetrical triangle.
Ascending triangle:
This form of triangle usually takes a bullish formation meaning that it usually indicates the likelihood of an asset price increasing while the pattern gets itself completed. The pattern for this type of triangle is created with two trendlines of which the first line lying in top the other is the resistance point of which when the assets price breaks above it, indicates the beginning of an uptrend. While the second trendline lying below acts as a support point. The bottom line is basically achieved by series of higher lows and is used to identify a good buying opportunity.
This ascending triangle is usually viewed as a continuation pattern. Being that ascending triangle takes a bullish formation, it becomes very Pertinent to pay keen attention to the support lines as it usually signifies the exit of a bear move in the market and that buyers are at the verge of taking over the market by pushing the assets price above the resistance level which is depicted by the flat top triangle.
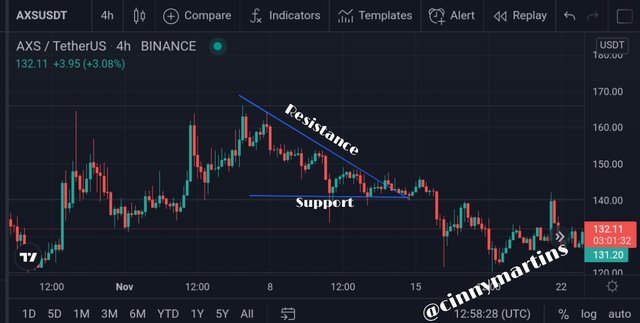
Descending triangle:
As the name implies, this is the direct of opposite of ascending triangle patterns which I discussed earlier. This triangle pattern arms traders with a bearish signal which indicates that the assets price will continue dwindling following when the pattern gets completed. The pattern for this triangle is formed by two trendlines but in this case, the top resistance point or line slopes downward while the support bottom line lies flat.
Another difference between the ascending triangle and Descending triangle patterns is that while the ascending triangle patterns is a continue pattern forming in an uptrend, the Descending triangle pattern is also a continuation pattern but forms in downtrend.
If the patterns forms in a long term uptrend, it is used to indicate the possibility of a reversal in the market and at most, a trend change. Mainly, this pattern is formed whenever the asset price falls and quickly bounces off above the support line and rises.
Symmetrical triangle patterns:
This pattern is commonly viewed as consolidation patterns by market analysts as it is used to either predict the continuation of an already existing trend or even a reversal in trend. This pattern on its own is formed as the ascending support and Descending resistance line interacts as the assets trading range decreases. Now, what happens next is that the assets price bounces back between the two horizontal triangles representing the trendlines and moving toward the top triangle that gets breakout from any possible direction to form sustained trend.
Worthy of note is that whenever a Symmetrical triangle is following a bull trend, the breakout is likely to take place right under the ascending support line which is used to signify market reversal in a downtrend move. Conversely, if a Symmetrical triangle follows a bearish trend, there's likely to be an upward breakout which is an indication of a market reversal in a bullish market.
Irrespective of a Symmetrical triangle breaking out in a sustained trend or trend reversal direction, the result generated by virtue of a price breakout from a triangle is enough to drive the asset price a reasonable distance. Hence, breakouts from Symmetrical triangle patterns are reliable signals used in predicting future trend of an asset which traders can heed to with some level of confidence.
CAN WE ALSO USE SOME INDICATORS ALONG WITH IT TRIANGLE PATTERNS? EXPLAIN WITH SCREENSHOTS.
YES
As a matter of fact, It is not advisable to embrace a single technical analysis as a standalone tool in trading as it may likely offer erroneous signals or fakeouts. That being said, market analysts opt to combine more than one technical analysis alongside indicators to get reliable signals although this may not be 100% accurate. One good thing about more than one tool is that it offers confirmation of signals from other tools.
Some known indicators that can be used alongside the triangle patterns technical analysis are:
- RSI
- A/D indicator.
RELATIVE STRENGTH INDEX
RSI is technical indicator employed to carry out analysis in financial markets. This indicator is basically used to display the current and historical strength of an asset on the chart by relying on the closing price of the asset for a particular period of time. With this indicator, traders can easily ascertain the peak of recent price changes so as to evaluate the overbought and oversold region of an asset.
The RSI indicator is ranged from 0-100. And according to traditional usage of RSI, the range of 70 and above suggests that an asset Is becoming overbought hence, an indication of a price reversal while RSI ranging from 30 downward is an indication that an asset is becoming oversold. In other words, whenever the RSI indicator surpasses the horizontal line range of 30, it signifies a bullish trend but when it is below the horizontal range of 70, it indicate a bearish sign.
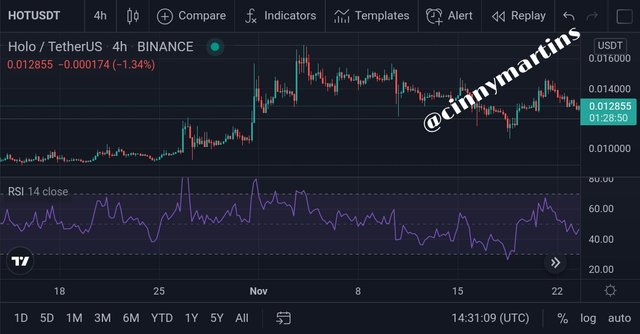
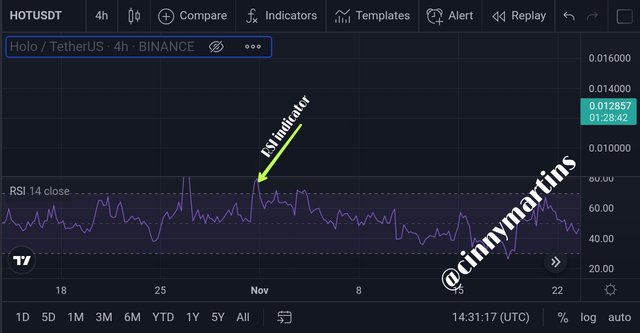
From this image, the RSI is captured at the oversold region which is also replicated at the chart as a downtrend and thus, a good entry point for traders. As clearly seen, it didn't take long you noticed a slight upward move.
Also when the price starts trending upwards the RSI replicates this move by entering the overbought region and the implication of this change is that investors tend to sell off their assets in anticipation of a change in the market move towards the bearish end.
As clearly seen from the image above the RSI at the overbought region which is indicated by a vertical line is replicated by an uptrend in the price chart signifying an exit point in the market as the bearish move is about and from the image, it didn't take long for this downward move to begin. so, relying on this RSI indicator now investors take the trading decision that may likely suit their trading strategies.
A/D INDICATOR
A/D indicator which stand for accumulation/Distribution indicator is a single line technical indicator used by financial markets and institution to analyze the market. This type of indicator is mainly used to indicate when an asset is in its distribution phase or its accumulation phase. The Accumulation phase is a phase when investors are accumulating the assets to continue a progressive increase in price to generate an uptrend while the Distribution phase is when investor decides to sell off their assets to take profits.
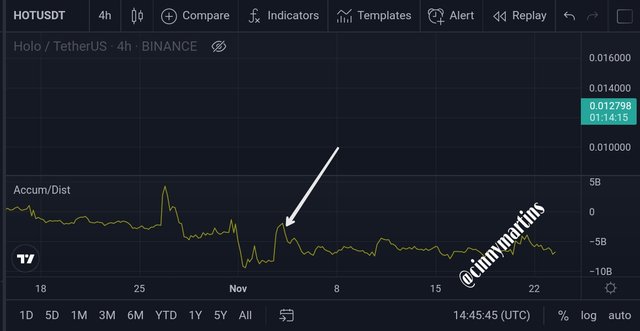
The A/D indicator is a well known indicator in trading used in indicating the accumulation and distribution phase of an asset by using the price action and volume. Far from this, the A/D indicator is also used to indicate the end of each phase in the market as well as the beginning of another phase and this is what helps most traders strategize a good market decision and maximize profits in trading.
Meanwhile, the A/D indicator is also called volume -based indicator and this is owing to the fact the indicator and the price moves in tandem positions but there could be instance where the price is trending up and the indicator will take an opposite direction. This does not mean that neither the signal of the price nor indicator is erroneous rather it means that there is no much volume for price increase and this signifies a weakness in trend and simply means that the trend will not last long.
EXPLAIN FLAGS IN TRADING IN YOUR OWN WORDS AND PROVIDE SCREENSHOTS OF BOTH BULL FLAG AND BEAR FLAG.
First and foremost, a flag pattern is a continued chart pattern that represents the Japanese candlesticks in a small parallelogram. As its name implies, the pattern has similar look with a flagpole or a flag. It is a consolidation area that shows a contrary trend move which comes immediate after an aggressive price movement. With this pattern, investors are allowed entry into the market amidst the trend with the knowledge that the prevailing trend will continue.
Flash flag pattern is a rigid trending move represented by large bodied candles on your chart accompanied by a walk pullback which is usually represented by small bodied candles. The flash pattern mostly run in between two parallel lines which may worker be slanted upward or downward or sideways as the case maybe.
The flag patterns are one of the most reliable patterns that traders employ to generate setup to enter already existing trends. The flag patterns tend to follow the same pattern as volume and breakouts. These patterns show decreasing trade volume immediate after an initial increase. This means that during the consolidation periods, traders who push the existing trends have less need to continue with their transactions thus, fastening the possibility of new investors taking up the responsibility of pushing the trend with enthusiasm. Trading with patterns enable traders to identify the direction of a trend as well as an already existing trend using breakouts.
There are two examples of flag patterns
- Bullish fish pattern
- Bearish flag pattern.
Bullish flag: The asset price rises after an initial increase and then decreases at the consolidation point. This shows that there is maximum buying pressure which tends to increase the price of an asset and indicates also that the move will continue in an uptrend. Traders will have to wait for the price to shoot above the resistance of the said consolidation area before entering the market. Here, the breakout is used to indicate that the initial uptrend will continue.
Bearish flag: This pattern indicates a slow consolidation after a strong downtrend. In otherwords, it is used to indicate that the seller have aggressively taken over the market which is pulling the price down and also to indicate that the move will continue in the downtrend move. To enter in a short position, traders have to exercise patience until the price breaks below the consolidation area.
SHOW A FULL TRADE SETUP USING THESE PATTERNS ON ANY CRYPTOCURRENCY CHART. (ASCENDING TRIANGLE, SYMMETRICAL TRIANGLE, BEAR FLAG)
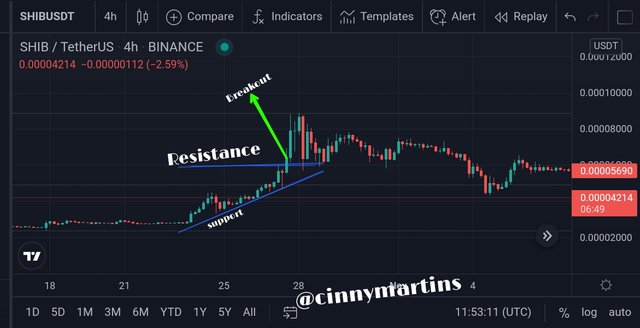
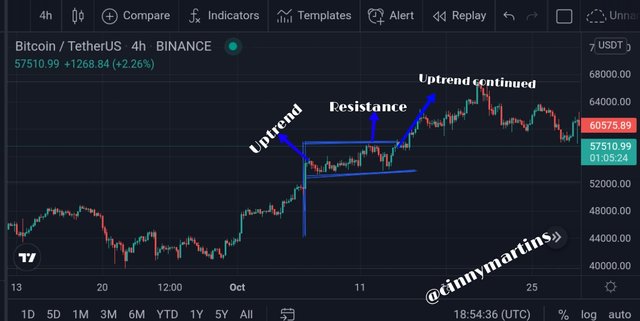
Ascending triangle
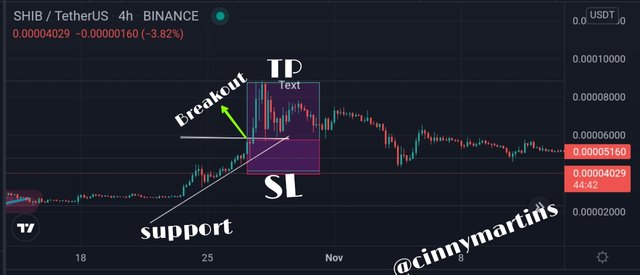
The chart above depicts an Ascending triangle with breakout from whence I made my entry outlined with both resistance and support line.
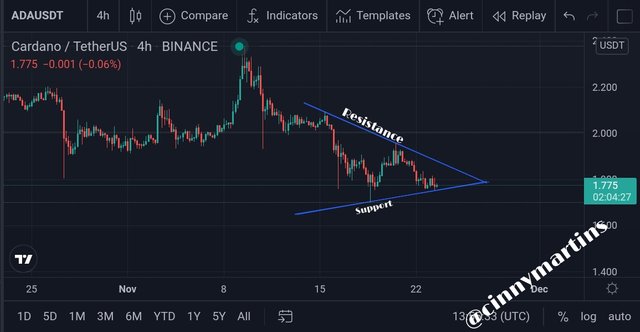
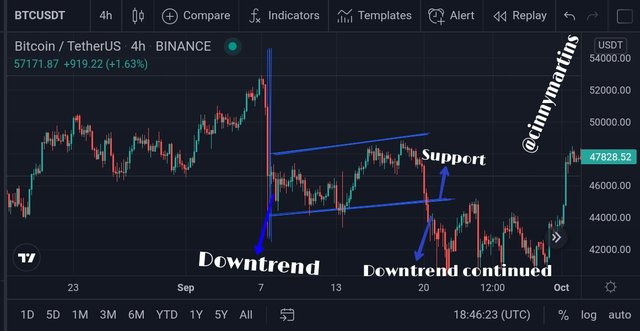
Symmetrical triangle
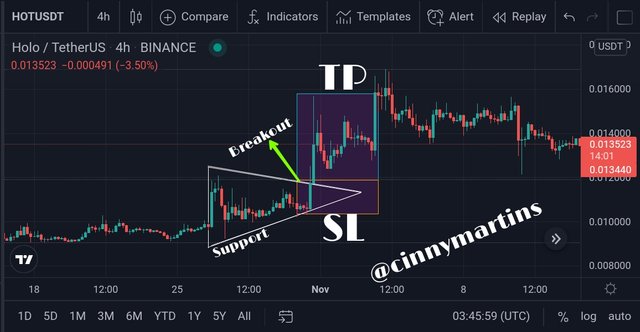
This image, depicting symmetrical triangle depicts an initial increase in the assets price and decreases afterwards. The price upon reaching the support line on top shoots off again to a continuing uptrend move.
Bear flash
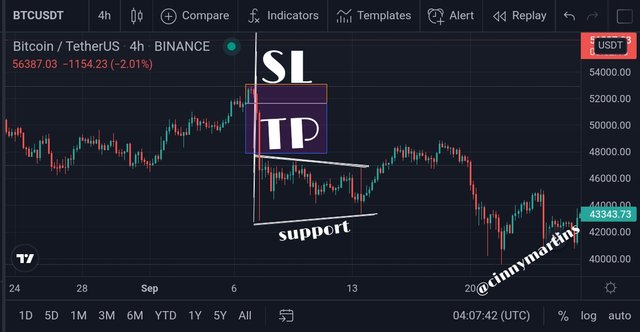
Now: All screenshots are products of Tradingview platform.
Cc.
@sachin08