Crytpo Academy Season 4 [Beginner's course] Homework post for Prof @reminiscence01 || Task 10: Candlestick patterns.
1a) Explain the Japanese candlestick chart? (Original screenshot required).
b) In your own words, explain why the Japanese Candlestick chart is the most used in the financial market.
c) Describe a bullish and a bearish candle. Also, explain its anatomy. (Original screenshot required)

1a) Explain the Japanese candlestick chart? (Original screenshot required).
b) In your own words, explain why the Japanese Candlestick chart is the most used in the financial market.
c) Describe a bullish and a bearish candle. Also, explain its anatomy. (Original screenshot required)

1a) Explain the Japanese candlestick chart? (Original screenshot required).
The Japanese candlestick chart was invented by a Japanese rice trader Munehisa Gonna in the 1700s in Japan. The Japanese candlestick chart is a tool; preferably a trading tool used to determine the price trend of an asset within a particular period of time.
The concept of the Japanese candlestick chart is a principle used even in our traditional trading to determine the opening and closing point, the highest and lowest price of an asset and how the market reacts to all these changes. Behind this concept, is the principle of supply and demand which is the chief determinant of the price movement of an asset.
The Japanese candlestick chart is a price indicator in a chart representation used by traders to run analysis for the price of an asset and also to predict future changes likely to occur in the market. Most of all, the Japanese candlestick chart is a trading tool used mostly in crypto, forex and stock trading to indicate when the market is either in a bullish or bearish trend.
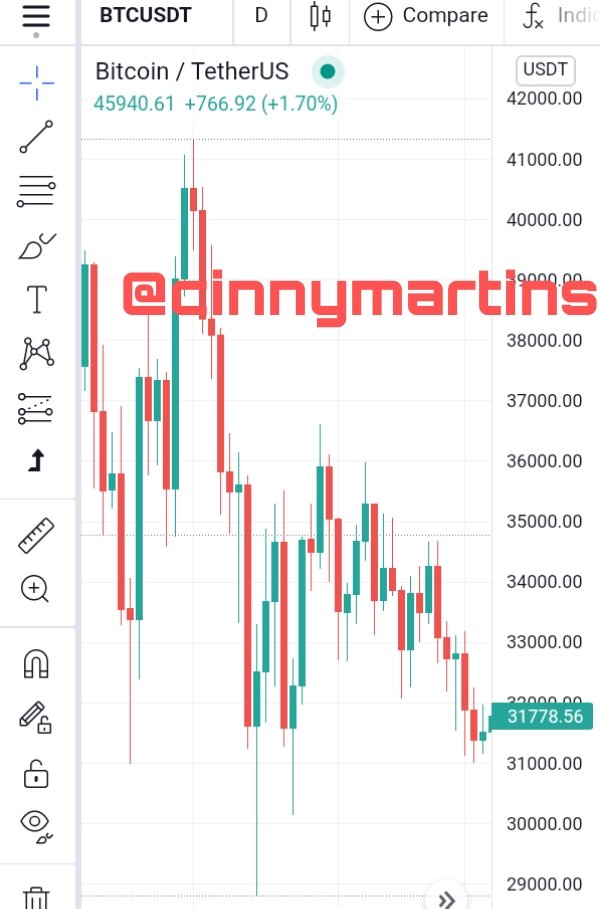
Here is an example of what a Japanese candlestick chart looks like
b) In your own words, explain why the Japanese Candlestick chart is the most used in the financial market.
As earlier said, the Japanese candlestick chart is used to analyze the price movement of an asset. It is mostly used in the financial market for the following reasons:
Financial markets adopt the candlestick chart because it is more detailed and accurate in the sense that the traders by mere looking at it can have a detailed study of chart and price movement within a particular period of time.
With the aid of the Japanese candlestick chart, financial markets and traders can have a study of the open and close points, high and low points of a trade.
It helps both buyers and sellers in their trading strategies as well as to reduce lost to the barest minimum and maximum profits in trading.
c) Describe a bullish and a bearish candle. Also, explain its anatomy. (Original screenshot required)
Source
The candlestick is of two types:
A bullish candlestick and
A bearish candlestick.
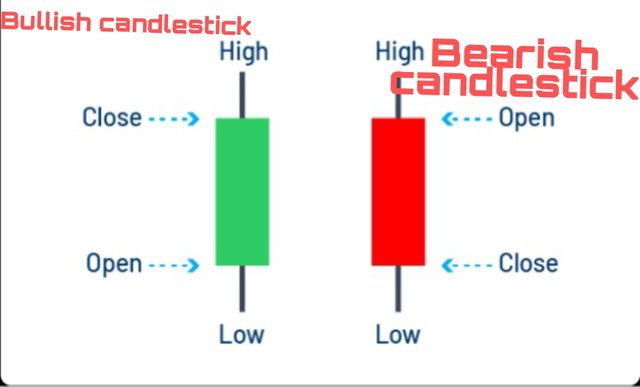
A Bullish candlestick
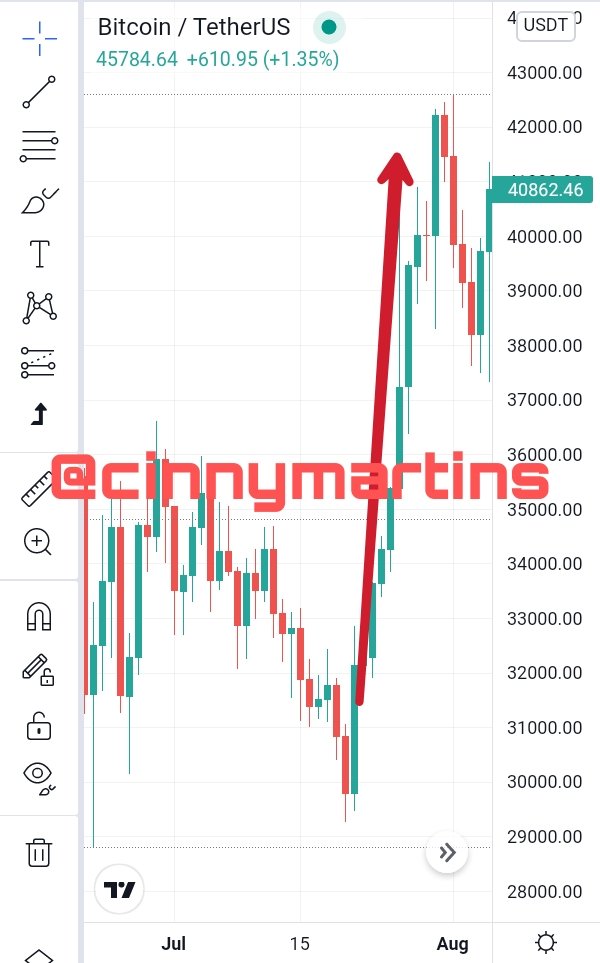
A Bullish candlestick is used to indicate a reversal movement usually in the uptrend which is used to indicate a higher demand of an asset highlighted in green color. A candlestick is bullish if it is placed above a previous candle showing that there is an increase in price or showing the probability of a price movement in the upward trend.
Anatomy of a Bullish candlestick
A bullish candlestick is comprised of 4 main parts:
- Open
- Close
- High
- Low.
Open: This is also referred to the opening price. This is used to indicate the movement of the price in an upward direction. This is the point and price at which the market opens for the day or period.
Close: This is the opposite of the opening price. It signifies the end of the candlestick for a period of time and it is usually the last price recorded for the period.
High: This is particularly the highest price or point an asset has reached over a period of time. The highest point in the bullish candlestick is usually seen above the close point or at the same point as the close point as the case may be.
Low: This is the lowest price or point an asset gets to over a period of time. The lowest price a bullish candlestick is usually seen is below the open point or at the same point as the open point as the case may be.
A Bearish candlestick
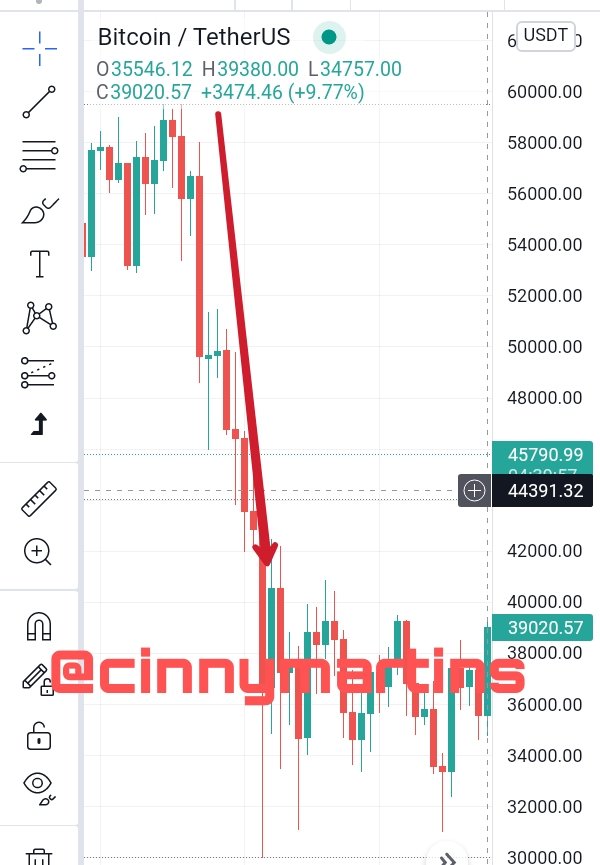
A candlestick is bearish if it occurs at the point where the price is higher than the close price. It is used to indicate a downward movement usually represented in a red or black colour. The movement of the candlestick towards the bearish trend is used to signify a greater supply over demand.
The bearish candlestick is normally placed in top of a previous candle close or even at the same point as the case may be.
Anatomy of a bearish candlestick
The parts in a bearish candlestick are:
- Open
- Close
- High
- Low.
Open: This is just the point where the candlestick begins within a particular period of time. It marks the beginning of a price movement in the bearish direction.
Close: This signifies the end of the candlestick within a particular period of time. By this, I mean it is the last price of an asset over a period of time.
High: This is the highest point or price for which an asset has reached within a time frame. The highest point in a bearish candlestick is usually place above the open point or even at the same point as the open point.
Low: This also signifies the lowest price an asset has reached within a particular time frame.
Conclusion
In all, the Japanese candlestick is a "Can't do without" for every trader and is recommendable that every trader studies it so well in other to elude losses in trading.
Cc.
@reminiscence01
¡Exelente! Buena publición @cinnymartins