
Hello guys, the fourth week of the Crypto academy os here and what Joy this gives me to be a part of the scholars. Its always a pleasure to learn here. Today I'll be talking about an indicator, The TRIMA indicator that seems to work like the doubling of the simple moving average. This work was inspired by the lecturers and assignment give by prof
@fredquantum. Sit back as I explain a few concepts here.
What is your understanding of the TRIMA indicator?
Setup a crypto chart with TRIMA. How is the calculation of TRIMA done? Give an illustration. (Screenshots required).
Identify uptrend and downtrend market conditions using TRIMA on separate charts.
With your knowledge of dynamic support and resistance, show TRIMA acting like one. And show TRIMA movement in a consolidating market. (Screenshots required).
Combine two TRIMAs and indicate how to identify buy/sell positions through crossovers. Note: Use another period combination other than the one used in the lecture, explain your choice of the period. (Screenshots required).
What are the conditions that must be satisfied to trade reversals using TRIMA combining RSI? Show the chart analysis. What other momentum indicators can be used to confirm TRIMA crossovers? Show examples on the chart. (Screenshots required).
Place a Demo and Real trade using the TRIMA reversal trading strategy (combine RSI). Ideally, bullish and bearish reversals. Utilize lower time frames with proper risk management. (Screenshots required).
What are the advantages and disadvantages of TRIMA Indicator?
What is your understanding of the TRIMA indicator?

I would basically say this indicator is the doubling of the simple moving average. Why did I say that? We'll get to that shortly, for now lets take care of something else.
What does TRIMA stands for? Its the short form of Triangular Moving Average. So yeah, its a moving average indicator, another type different from the regular ones we know. The fact that its a moving average indicator makes it a lagging indicator and usually follows trend of the market rather than predict the trend of the market. So how does it function?
Well the TRIMA indicator is "double smoothed", that is to say, it performs the average of the average prices, basically averaging the prices twice to give a position in the market. Let me give an illustration here: remember how the simple moving average worls by calculating the average price of a given period in order to get to its current position, then note this when I say that the TRIMA indicator performs the average if the Sma indicator, in essence it performs the average price of a given period twice.
This makes the indicator to become less reactive to the volatility of the market and shows a much more clearer trend of the market because of its double averaged action.
Setup a crypto chart with TRIMA. How is the calculation of TRIMA done? Give an illustration. (Screenshots required).
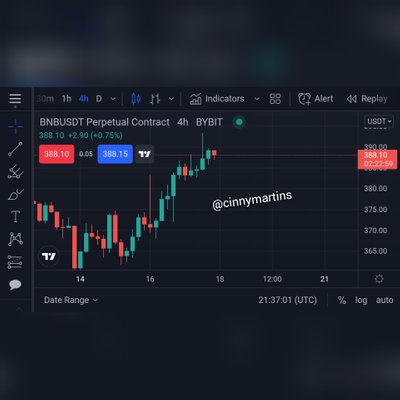
Having heard of this indicator now, you may want to try it out but don't know how to do so. In this section I'll explain to you how to setup this indicator in your chart and I'll also show you the underlying principles of the indicator, that is I'll show you the calculations basics of the indicator. I'll make use of the trading view platform on which you'll find a host of indicators and tools at your disposal.
Now lets set up this Indicator on our chart. First thing you want to do is to choose your trading pair, any trading pair of your choice will be fine for now. Once you get to the landing page, the one that displays the charts of the pair, you'll get to notice there are different icons around the chart, all of which have a different function.
Looking at the top of you screen, you'll see some icons placed there too. Perfom a little side scrolling at the top and you'll see the "Indicators" icon there. Click on it to get a list if indicators.
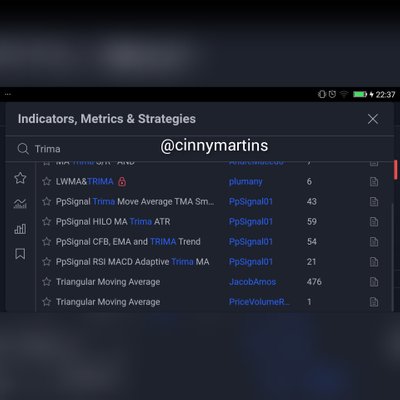
You may not easily find the TRIMA indicator from there but its easier to just search for the indicator by imputing the name of the indicator in the search bar. Do this and the TRIMA indicator will show up, click on this to have it applied to your chart. Its that simple.
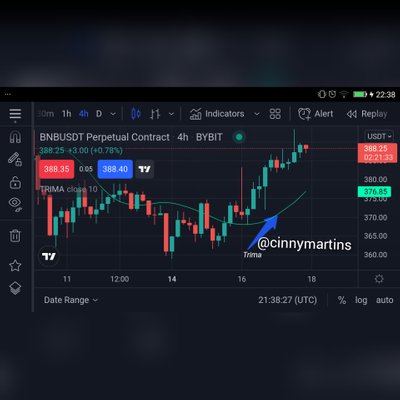
There are various other parameters of the indicator that you could adjust to your preference like the color of the indicator, the number of periods and so on. Click on the indicator which is now on the chart and you'll see a small settings icon by the left hand side, click on this icon to tweak the various parameters.
Calculations of the TRIMA indicator
Remember how I said that the trima indicator is based off the simple moving average indicator, that is to say it performs the average of the simple moving average, making it double averaged (double smoothed). This will make us have a basic understanding of the sma before calculating the trima.
So the formula for the sma is as follows;
SMA = (X1 + X2 + X3...... Xn)/n
Where
X1-3 = the periods representing the price of the asset.
Xn = last number of period taken into consideration
n = total number of periods taken into consideration.
Having done this, we can now get the value of the TRIMA;
TRIMA : (sma1 + sma2 + sma3.......sman)/n
Where:
SMA1-3, SMAn = Simple moving average value of the respective period.
n = total number of sma periods.
So there you have it, the calculations of TRIMA indicator. All these calculations are done in split seconds so you don't have to worry about always having to calculate for yourself.
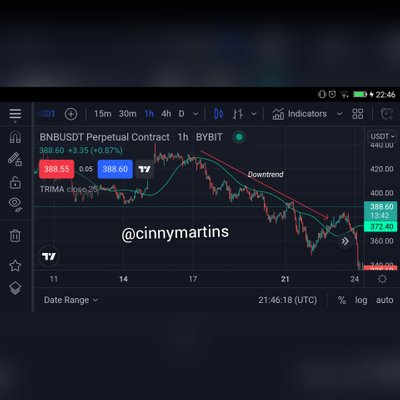
Identify uptrend and downtrend market conditions using TRIMA on separate charts.
The market is made up of trends of which could be an uptrend or a downtrend and a trend has certain characteristics. An uptrend is characterized by the formation of higher highs and lows while a downtrend is characterized by the formation of lower lows and highs. So in essence, you'll see and uptrend generally moving upwards of the market while a downtrend will generally move downwards of the market.
Most people will easily identify these trends while others might need some help. The trima indicator tool will be of great help when identifying these trends.
How to identify an uptrend/downtrend
Easy identification of an uptrend while using this tool will somehow depend in the number of periods of the indicator. What I'm saying is, when you choose to use a smaller amount of periods, the indicator tend to cling to the chart thereby making it hard to notice, while you'll clearly see the indicator when it contains more periods.
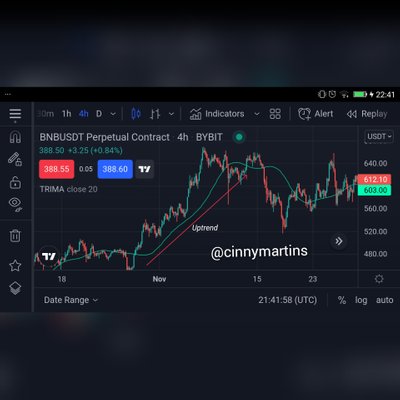
The identification of an uptrend is simple. Once in an uptrend, the market generally trades above the indicator and be angled upwards while that of the downtrend is just as simple, the market will trade below the indicator and angled downwards and all this can be seen clearly too.
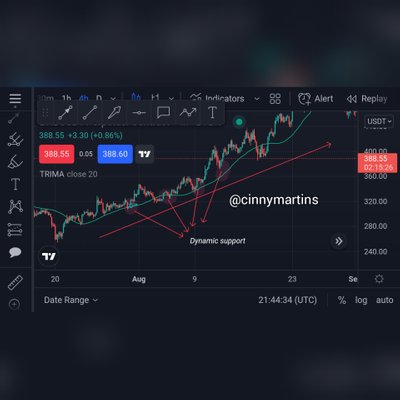
With your knowledge of dynamic support and resistance, show TRIMA acting like one. And show TRIMA movement in a consolidating market. (Screenshots required).
Support and resistance is another great tool of technical analysis in todays market which usually invloves the drawing of lines. But do you know we could actually make use of the support and resistance, at least the principles, without actually plotting any lines on the chart? Well I've just told you know and I'll show you how. These are regions in the market that prevents further progress of the market to the upside (resistance) or to the downside (support).
Ever heard of the term, "Dynamic support/resistance"? Ok. I'll simply explain this as the support/resistance that involves the use of an indicator rather than the traditional lines plotting we know. In this case the Trima indicator will act as a dynamic support/resistance. I'll explain further.
Since we may not be too familiar with the Trima indicator, let me use the Sma as an example as they are closely related, and apply the same principles. When in an uptrend, the market generally moves upwards and trades above the indicator but over time we've come to notice that thw market don't just move straight up while in an uptrend but there are times when the market takes a break and comes down a bit, before continuing its journey up. This is what we know as pullbacks in the market.
Looking closely at those pullbacks, you may notice that some of the points were bouncing off the indicator and then continues its journey upwards. In this case we can say that the indicator has acted as a dynamic support for the market.
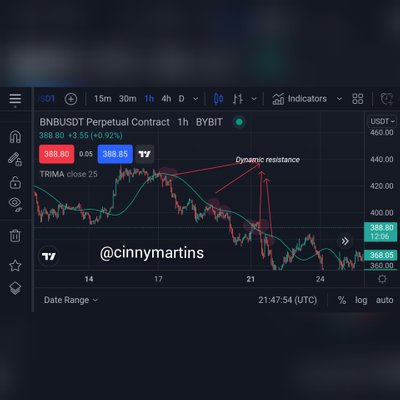
The same can be applied for a downtrend. When in a downtrend, the market trades below the indicator but there are times of pullbacks but notice how some certain pullbacks are hindered by the indicator. In this case the indicator has acted as a dynamic resistance to the market.
Trima in a consolidating market
So what is a consolidating market? Well its simply a market without a clear trend. Its one that's constant moving up and down within a region without actually making any clear trend. This occurs often in the market and causes lots of traders headaches and losses too.
The trima shows that we're in a consolidating market when you see the charts constantly crossing the indicator. The indicator, which is a trend indicator can't spot a clear trend in this instance. In essence it is immersed within the chart in situations like these.
Combine two TRIMAs and indicate how to identify buy/sell positions through crossovers.
In this section, I'll explain how to spot good entry positions through the combination of two Trima indicators.
Firstly, what are cross overs? Well these are situations where two indicators, usually moving averages cross each other. It usually invloves the use of two indicators, one which is slower cos it contains more periods while the other reacts faster cos it contains lesser periods. In general, its the faster indicator that crosses over the slower one.
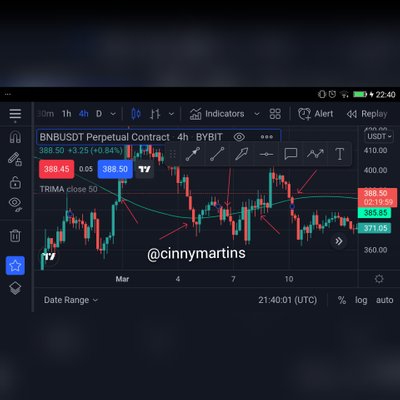
To make use of the TRIMA cross over, we'll have to place two Trima indicators on the screen first of all. Follow the steps explained above and click on the indicator twice to apply two. The you also have to set the parameters too. For the faster one, I'll choose 50 periods while I'll make use of 200 periods for the slower one. This is a general setup for trading Crossovers in the market, especially for long term traders/investors.
Buy crossover
The buy crossover can be seen when the faster Trima indicator crosses over the slower Trima indicator to the upside. This usually results in an uptrend so a trader can take a buy position based on this.
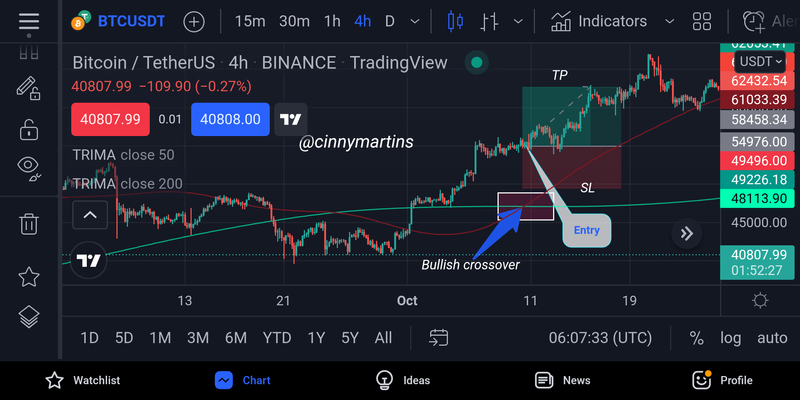
In the image above, see how the faster moving average crossed the slower moving average to the upside which resulted to an uptrend in the market. Traders can make an entry at the point of the cross over.
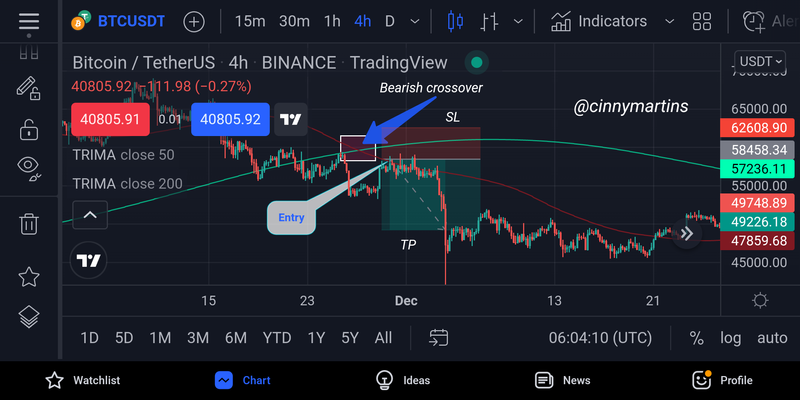
Sell crossover
What goes up, comes down. This is simply the opposite of the buy crossover. In this case, the faster moving average crosses over the slower moving average to the downside and thereby results in a downtrend most of the time. Traders can make an entry into the market based on this Crossover.
 )
)
In the image above see how the faster Trima indicator crosses over the slower Trima indicator to the downside and ultimately led to a downtrend in the market.
What are the conditions that must be satisfied to trade reversals using TRIMA combining RSI? Show the chart analysis. What other momentum indicators can be used to confirm TRIMA crossovers? Show examples on the chart. (Screenshots required).
A reversal is simply the change in trend of a market. That is to say, a market had completed a reversal when it changes trend, from an uptrend to a downtrend or the other way around. There are various means by which we could identify them and certain criterions must be met in order to successfully trade these reversals.
One way to spot a reversal is through crossovers, which involves the use of two indicators, in this case the Trima indicator and another way to spot a reversal is through use of another indicator, the RSI indicator. But who said they can't work together? There are just certain conditions that must be met for them to coexist harmoniously.
Bullish reversal
A bullish reversal is simply the market changing trend from being bearish to being bullish. To trade this, we can simply follow these guidelines;
Apply two Trima indicators on your chart, one has to be slower than the other one, then you could also add the RSI indicator on the chart.
The RSI indicator has an oversold and overbought region. In a downtrend, the market mostly reaches the oversold region and this indicates that a reversal is imminent. Confirm that this has occured on the RSI.
Watch to see if there has been any crossover between the Trima indicators. The faster one has to cross over the slower one to the upside.
You can make a successful entry after 2 confirmations and make use of proper risk management. I'll recommend using the 1:2 risk to reward ratio.
Bearish reversal
A bearish reversal simply implies a change in trend from a bullish trend to a bearing trend indicating thw bears have taken over the market. Follow these guidelines to successfully trade this indicator.
Make sure to apply two Trima indicators on the chart with one being the slower of the two and then bring on the RSI indicator to the chart.
The market generally reaches the overbought region of the RSI indicator when in an uptrend and this indicates that a reversal, a bearish reversal is imminent. Watch out for this move.
There should be a crossover between the slow and fast Trima indicator. The faster indicator will have to Cross over the slower indicator to the downside to further confirm the Bearish reversal.
You can make an entry into the market after two successful confirmations. Be sure to apply proper risk management too.
Place a Demo and Real trade using the TRIMA reversal trading strategy (combine RSI). Ideally, bullish and bearish reversals. Utilize lower time frames with proper risk management. (Screenshots required).
In this section, I'll further demonstrate my knowledge on this course by placing actually trades after having done analysis with the Trima indicator tool. One of the trades will be a demo trade, not in loving real cash while the other one will be a real trade.
Demo trade
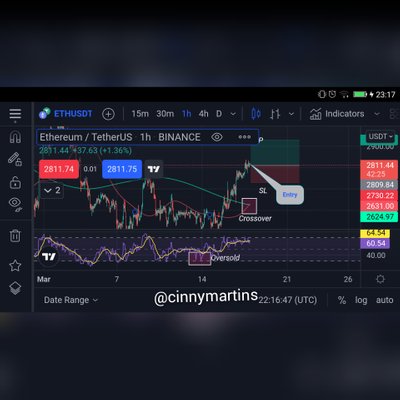
For the demo trade, I'll make use of the trading view platform for my analysis while also perform the trade on the paper trading section of the trading view platform. I'll make use of two technical analysis tools as i try to trade the bullish reversal, these tools are the Trima indicator and the RSI indicator. The trima indicator will comprise of two Trima indicators, a slow one and a faster moving one.
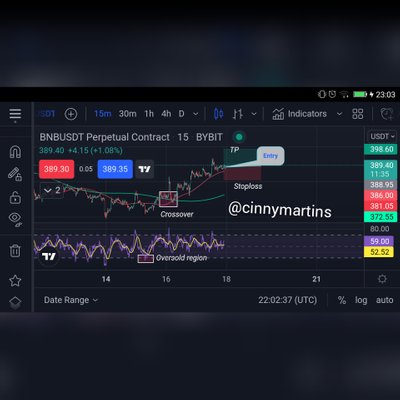
From the image above, you can see clearly how the market has changed direction from a bearish to a bullish trend. Also spot how the RSI indicator was in an oversold position before actually taking a turn to the upside.
The Trima indicator cross over also went on to confirm the bullish move. The faster moving trima jas crossed over the slower moving Trima to the upside which indicated a bullish move.
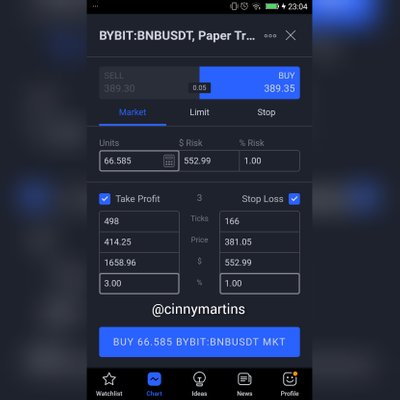
In this image, I made an entry into to market. It was a market but order placed at the point of cross over. Proper risk management was applied too, with a 2:1 reward to risk ratio. You can see the details of the trade here too.

Real trade
This section involved the use of real money. I made use of the same parameters set for the demo trade and traded a bullish reversal on a crypto asset. Analysis was done on the trading view platform while the trade was actually placed on the Binance platform.
As observed in the image above, the market was set for a bullish move and different parameters were there to confirm that too. First it was the RSI indicator which was already in an oversold region before the actual change of trend.
Then the crossovers occured. Where the faster moving trima crossed over the slower moving Trima indicator to the upside. This showed that the market was all set for a bullish move. I made an entry point on the chart with proper risk management.
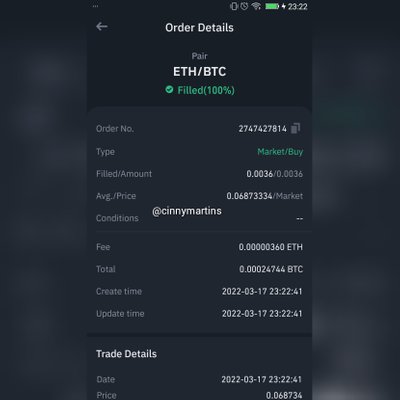
From the image above, you'll come to learn that I've made the actual trade on the Binance platform, it was a market order trade based on the analysis of the market on the trading view platform. I bought the commodity on the spot market on Binance as I plan tl hold this tool for a while.
What are the advantages and disadvantages of TRIMA Indicator?
Advantages of TRIMA Indicator
It saves traders from sudden loss in the market due to sudden increase on volatility/manipulation of the market by the big guns. This is so because its a lagging indicator and reacts somewhat slower to the market moves.
Dynamic support/resistance. This comes in handy especially when one doesn't know how to properly draw a support/resistance line in the chart. The fact that the tool can easily perform this function makes it a plus.
Suitable for traders who wish to ride the tide of the trend because this indicator is a trend following Indicator.
Disadvantages of the TRIMA indicator
Its a lagging indicator. Well this has come in as an advantage and a disadvantage too. Its a type of indicator that has to take into consideration of the past events/price of the asset to give a current value. For this, the indicator may react late at times, after the trend must have been over.
It a trend following Indicator. It may not be suitable for those who wish to be on the front foot in the market and try to predict the future price of the market.
Conclusion
Well the trima indicator is one that will be of great help in the world of trading especially in technical analysis. Through the course of this lecture, I've come to learn something new about this wonderful indicator.
Its a double smoothed kind of indicator that functions basically by performing thr average of the average of the market prices. It performs the average of the simple moving average in it calculations. Its a trend following Indicator and reacts more slowly to the current price of the market.
Its also prone to give off false signals but this can be countered by the use of confluence trading. You may wish to make use of the crossovers, which involves the use of two Trima indicators on a chart, one is slower while another is faster. Another valuable combo would be to use the Trima indicator with the RSI indicator.