Hello guys, the 4th week of the steemit crypto academy is here again and with lots of goodies and knowledge to be gained, I'm really excited. This time around I'll be talking about an indicator, the Median Indicator. This work was inspired by the comprehensive lectures of prof
@abdu.navi03, sit back while I share my knowledge with you.
1-Explain your understanding with the median indicator.
2-Parameters and Calculations of Median indicator. (Screenshot required)
3-Uptrend from Median indicator (screenshot required)
4-Downtrend from Median Indicator (screenshot required)
5-Identifying fake Signals with Median indicator(screenshot required)
6-Open two demo trades, long and short, with the help of a median indicator or combination that includes a median indicator (screenshot required)
Explain your understanding with the median indicator

Indicadors have become one of the most important tools of trading in todays world, newbies as well as gurus wishes to make use of the all important tool for better trading decisions. Its no surprise that there have been a lot of the appearing recently which of course have been very helpful as they have been made to suit the various demands of traders.
The median indicator, although not so new in the trading world, but for a learner like me, it new. Its new to me but not difficult to understand and I love that about the indicator as I didn't need to solve 'rocket-science' to understand the principles of rhe indicator.
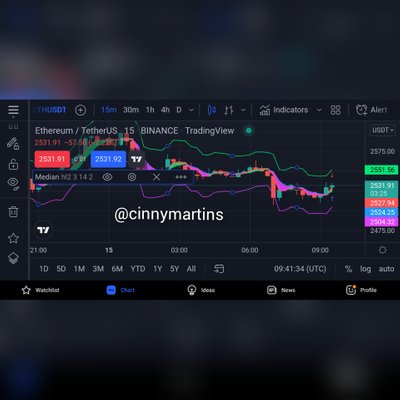
So what is this Median Indicator? Well in the most simplistic explanation I can give, its simply a tool that helps improve traders decisions and possibly their success rates. Its characterized by a median line with an upper and lower band attached to it. This median line has some colors too and even though they may appear beautiful, they actually have a story to tell about the market.
The median line has two colors, the green and the purple color which indicates a bullish and bearish move in the market respectively. These colors can ve changed from the default to you preference. When the market crosses over the median line to the upside, it appears green and appears purple when the market crosses over to the downside.
The upper and lower band shows the volatility of the market that is they show when the market is most active and less active by simply expanding and contracting respectively.
How to apply the median indicator
One platform where you'll most definitely find this indicator is the trading view platform.
- Once on this platform, select any trading pair of your choice and this will open up the chart for the selected pair.
- Next you'll do is to look at the icons at the top of your screen and you'll see indicator icon click on this to open a list of indicators available on the platform.

- You can simply search for the median indicator by typing it in the search bar and then click on the indicator when its found to apply it on your chart screen. You can also choose to reset the default parameters of the indicator.
Parameters and Calculations of Median indicator. (Screenshot required)
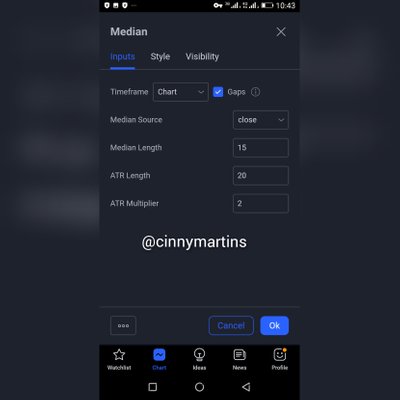
Remember how I said you could reset the default parameters of the indicator to your preference, well I'll explain that in details in this section as well as to show you how this parameters were calculated.
So far, I've come to understand that most indicadors perfom well because of some ingenious calculations that has been preset by the developers. These calculations are done so fast and efficiently that you don't need to bother about them. The median indicator has some calculations that helps it function effectively and I'll show you a glimpse of the calculations carried out.
The general formula of the median indicator is as follows;
Median Value = Highest price + Lowest price / 2
EMA Value = Closing price * Multiplier + EMA(Previous day) * (1 - Multiplier)
Where;
Median Indicator = ATR %change ( Median Value, EMA Value)
If EMA %change >= Median Value, Purple Colouration
If EMA %change >= EMA Value, Green Colouration
Upper band = Median length + (2ATR)
Lower band = Median length - (2ATR)
From the above formulas, you can see how the median indicator does its calculations to give accurate readings and predictions of the market. The Ema and the median value ate some what correlated in that when the value of the median is higher than the ema, the green color of the indicator appears which signals a bullish move while when the ema value is higher than the median value, then the purple color of the indicator appears which signals a bearish move.
As for the parameters, the default parameters set for the indicator includes the following;
All of these settings can be tweaked to suit the trader's preferences.
Uptrend from Median indicator (screenshot required)
Traders are well aware of thus fact that I'm about to state here, the market doesn't move in a straight line and is characterized by trends. Trends in market are what results to the volatility and profits/loss in the market. The median indicator which is a trend indicator is best suited for the trends in a market.
An uptrend in a market is characterized by the occurrence of higher highs and higher lows in the market and this is usually sustainable for a while at least. When in an uptrend, the market usually crosses over the median indicator, and this is one give away sign that the market is in an uptrend.
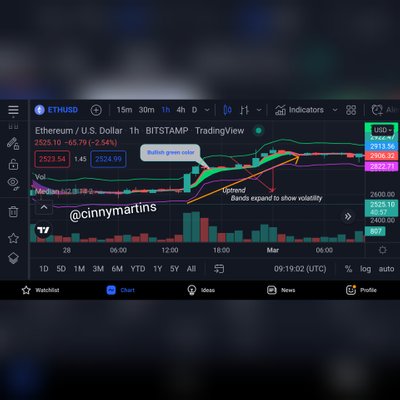
Another give away sign for an uptrend is the color of the trend. The indicator appears to be green when in an uptrend. The final give away sign for an uptrend is the expansion of the bands on the indicator. The bands measures volatility in the market and there's usually lots of volatility in a trending Market so the bands expand naturally.
All these signs put together can be used to make a good entry into the market and the exit strategy is usually set as soon as the color of the indicator changes.
Downtrend from Median Indicator (screenshot required)
Well, the downtrend is the opposite of the uptrend. The first thing you'll notice in a downtrend while using this indicator is that the market is generally below the median line.
Secondly, you'll notice how the color changes to be purple once the chart is below the median while the bands also expands to show the volatility of the market.
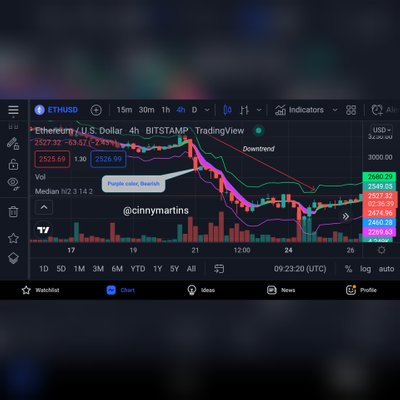
All these signs put together will make for a good sell signal in the market where the entry could be made once the indicator appears to be purple with the chart trading below the median. Your exit strategy could be set to exit once the indicator changes color.
Identifying fake Signals with Median indicator(screenshot required)
The occurrence of a false signal is not a current new and its one thats common with most indicadors. The best way to overcome this is to practice the use of confluence trading, where you confirm the signals of one indicator through various other means.
Take the rsi indicator for instance, the basics of this indicator is that you should expect the market to make a U-turn when the value is below the 30 threshold (oversold) and above the 70 region (overbought), but this is not always the case though.
To overcome this plight, we could make use of the median indicator as a form of confluence trading to help make better trading decisions.
In the image above, see how the rsi indicator was in an oversold region, where you'll expect the market to take a bullish turn, but this didn't happen, instead the market reminded bearish.
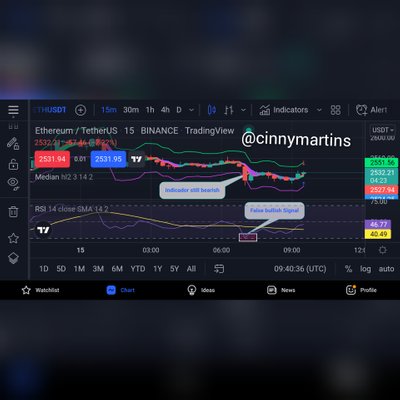
Thankfully the median indicator showed that the market was still bearish irrespective of what the rsi indicator was saying. This way, we've easily overcome the false signal given off by the rsi.
Open two demo trades, long and short, with the help of a median indicator or combination that includes a median indicator (screenshot required)
In this section, I'll further show my understanding of the topic at hand by making demo trades with the use of the indicator. All trades will be analysed and made on the trading view platform.
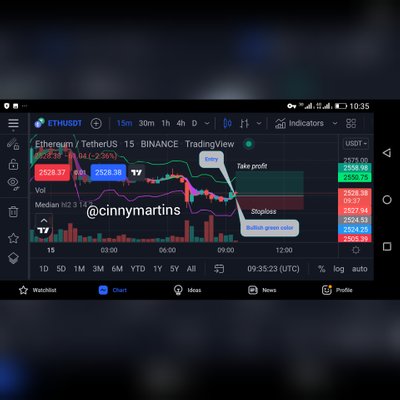
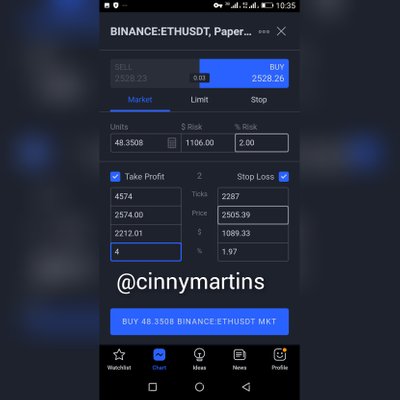
For a Bullish trade
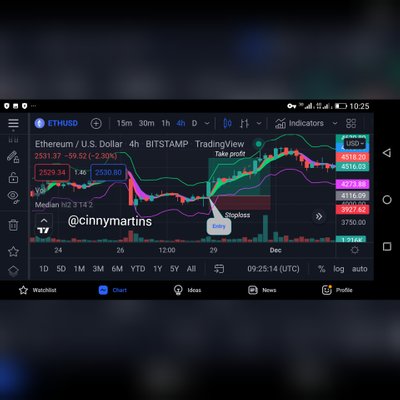
AKA going long. For this trade, I'll make use of the eth/usdt trading pair. After choosing this pair i went on to apply the median indicator on the chart for my analysis.
The following facts were considering before entering the trade.
Firstly, the market was trading above the median indicator. Secondly the color of the indicator was green which signifies a bullish move.
An entry was made upon the change of color of the median indicator to green. Stop loss was set a little below the median of the indicator while my take profit level was a bit reserved and set to be in a R:R of 2:1.
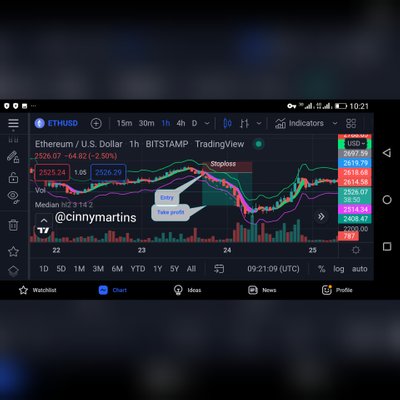
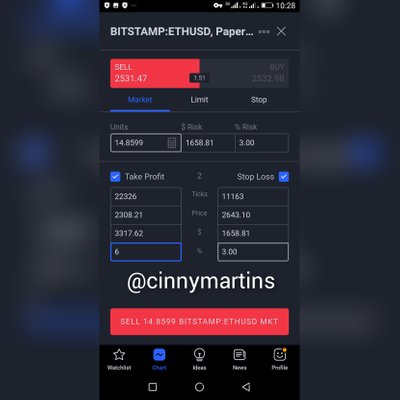
For a bearish trade
For this trade I'll make use of the eth/usdt pair to further show my knowledge and understanding of the subject. A few considerations were made before finally making a decision.
Firstly I watched to see that the market was trading below the indicator as we as take note of the color of the indicator. I chose to go short when it was purple.
Soon I made my entry when all the parameters for the trade were met. Stop loss of the trade was set a little above the colored indicator while I set my take profit to be a 2:1 ratio. That means I was willing to risk $1 for every $2 I hoped to gain.
Soon both trades were profitable.

Conclusion
Well this indicator is one that definitely fits into the kind of indicator that I prefer to use. Simple and efficient, thats how I'll describe the overall performance of the indicator. I hope to gain more mastery of this tool in the nearest future too.
It simply gives a bullish signal by the appearance of green color while the bearish signal is confirmed by the appearance of a purple color.