Crypto Academy Season 3-Week 5|| Homework post for Prof. @lenonmc21 |Trade with 'Simple and Exponential Moving Averages' +Application of 'Fibonacci Retracements' on the chart by @cinnymartins
 )
)
Am very delighted to be participating in this class by Prof. @lenonmc21 for the clear-sighted lecture delivered by him on the topic Trade with 'Simple and Exponential Moving Averages' +Application of 'Fibonacci Retracements' on the chart The assignment is divided into 2 aspects:
- The theoretical aspect,
- The practical aspect.
And based on the topic, i hereby submit a copy of my own assignment on the following questions.
- Define in your own words what are simple moving averages and exponential moving averages.
- Explain how simple and exponential moving averages are calculated.
- Briefly describe at least 2 ways to use them in our trading operations.
- What is the difference between simple moving averages and exponential moving averages (Explain in Detail)
- Define and explain in your own words what "Fibonacci Retracements" are and what their gold ratios are
Practice (Only Use your own images)
It shows step by step how to add a "Simple and Exponential Moving Average" to the graph (Only your own screenshots - Nothing taken from the Web).
Use "Fibonacci Retracements" to chart a bullish and bearish move (Own screenshots only - Nothing taken from the web).
QUESTION 1: DEFINE IN YOUR OWN WORDS WHAT ARE SIMPLE MOVING AVERAGES AND EXPONENTIAL MOVING AVERAGES?
Before i delve into the definitions proper, it will be pertinent to lay a foundation by first of all defining a Moving Average which by way of definition are analysis used by market investors to determine the direction in which a new trend is going. (Trend in this context means a general direction in which something is going or developing and can be uptrend when the price is going up and downtrend when the price is going down and then sideways trend when the price is going randomly but maintaining a similar move in direction.)
The main aim or objective behind calculating a moving average is to establish a similar form of stability in price and for investors to run with the needful analysis with regards to price fluctuations.
** IN YOUR OWN WORDS, WHAT ARE SIMPLE MOVING AVERAGES?
In my own understanding, a simple moving average otherwise known as SMA is the average price of a stock over a particular period of time. The simple moving average is usually plotted on a chart with moving lines that indicates the changes in the average value of a particular stock price. The results of an SMA is usually unbroken if it lasts for a longer period of time but within this longer period of time latency becomes a barrier.
The SMA is in the form of an indicator which usually indicates or is used to check if a stock price will increase or decrease within a specified period of time. It will also suffice to say that one disadvantage is that Simple Moving Average cannot be used to predict the future price of a stock.
IN YOUR OWN WORDS, WHAT ARE EXPONENTIAL MOVING AVERAGES?
In my own understanding, an exponential moving average also known as EMA is a type of moving average that tends to prioritize the recent data by relying on the historical average of a price stock...this is one difference that is Crystal clear between an SMA and an EMA.
Also, an exponential moving average is somewhat more technical than a simple moving average this is because, market analysts are only able to determine the future prices of a stock by studying and putting into consideration the recent and past market prices. So, one can say that traders who uses EMA have better privilege than traders who uses SMA.
QUESTION 2:EXPLAIN HOW SIMPLE AND EXPONENTIAL MOVING AVERAGES ARE CALCULATED
CALCULATING AN SMA
SMA calculates the average closing price of a stock within a specified period and to do this, you sum up the closing price and divide by the number of hours. I will be using SMA of 6hrs and will assume the closing price of the stock to be $10,$20,$30,$40,$50 & $60.
Firstly we will add up the number of stock:
$10+$20+$30+$40+$50+60=$210
Then we divide the total by number of hours
210÷6=35
=35✓.
CALCULATING AN EMA
Doing this is more technical than SMA calculations.
Formula=t×k+(y×1)
T=today
Y=yesterday
N=number of days
K=2÷(N+1)
We assume today's price to be $3
Yesterday's price to be $2
Number of days to be 3
K= 2÷(3+1)
2÷(4)=0.5
EMA= price t×k+(y×1)
3×0.5+(2×1)
1.5+(2)
=3.5✓
QUESTION 3: BRIEFLY DESCRIBE AT LEAST 2 WAYS TO USE THEM IN OUR TRADING OPERATIONS
Notably, the 2 major moving averages are used in determining the trend in the price of a stock and are used in the trading operations and they are both used for this purpose.
They are used as dynamic resistance and support: by this, it entails that moving averages are constructed to enable traders identify trend direction in a specific period of time and the simplest way to do this is to plot on the chart a sole moving average. The implication of this is that it indicates there is an uptrend when the price is above the moving average and vice versa and this is a guide to the trader.
It is used to determine whether a market is over-extended: with this, instead of the trader loosing his profits, it keeps him in check and waiting till the market normalizes.
QUESTION 4: WHAT IS THE DIFFERENCE BETWEEN SIMPLE AND EXPONENTIAL MOVING AVERAGES (EXPLAIN IN DETAIL)
SMA calculates the average closing price of a stock over a particular period of time while EMA calculates the recent price of a data.
In all ramifications SMA is the simplest form of moving average is is preferable by users who are new to trading while EMA is complex in nature and this could be seen in how it is been calculated.
SMAs are not used to determine the future prices of a stock and this is as against EMA which is used to determine future prices by studying and putting into consideration the recent and past market prices of a stock.
SMA is faster and less data consuming than EMA
QUESTION 5: DEFINE AND EXPLAIN IN YOUR OWN WORDS WHAT 'FIBONACCI RETRACEMENT'S ARE AND WHAT THEIR GOLD RATIOS ARE
The Fibonacci retracement is a tool used by traders to set prices and resistance levels. The Fibonacci retracement was designed by Leonardo Pisano in the 90s. It is used for both the bullish and bearish trend.
Sometimes after a powerful impulse in the market, traders who missed out of the first impulse waits and with the help of Fibonacci retracement they get to calculate and queue in for the next powerful impulse. The Fibonacci retracement is in form of random lines showing the resistance and support level in the chart.
The Fibonacci sequence numbers are 0,1,2,3,5,8,13,21,34,55,89,144... And they are gotten by adding the previous two numbers starting with 0. I will illustrate further:
0+1=1
1+1=2
1+2=3
2+3=5
3+5=8
5+8=13
8+13=21
13+21=34
21+34=55
34+55=89
55+89=144
It continues till infinity.
To get the Fibonacci retracement ratio, we divide the Fibonacci numbers instead of the normal addition.
Remember the Fibonacci numbers are 0,1,2,3,5,8,13,21,34,55,89,144 etc
The Fibonacci retracement ratio are gotten this:
0÷1=0
1÷2=0.5
1÷3=0.33
2÷5=0.4
3÷8=0.38
5÷8=0.63
5÷13=0.384
8÷21=0.38...
The Fibonacci golden ratio is 61.8 or 0.618.
The Fibonacci retracement levels mostly prioritized by traders are 23.6%, 38.2%, 50% and 61.8% and 78.8% but basically at 50% which they consider to be at the equilibrium level.
PRACTICALS ONLY
SHOW A STEP BY STEP ON HOW TO ADD A 'SIMPLE AND EXPONENTIAL MOVING AVERAGES' TO THE GRAPH (ONLY YOUR OWN SCREENSHOTS-NOTHING TAKEN FROM THE WEB)
I will be showing a step by step procedure on how to add a simple moving average and an exponential moving average and the application I will be using is MT4.
STEP 1: I had to download the MT4 from play store and then I installed it on my phone and then I clicked on the app.

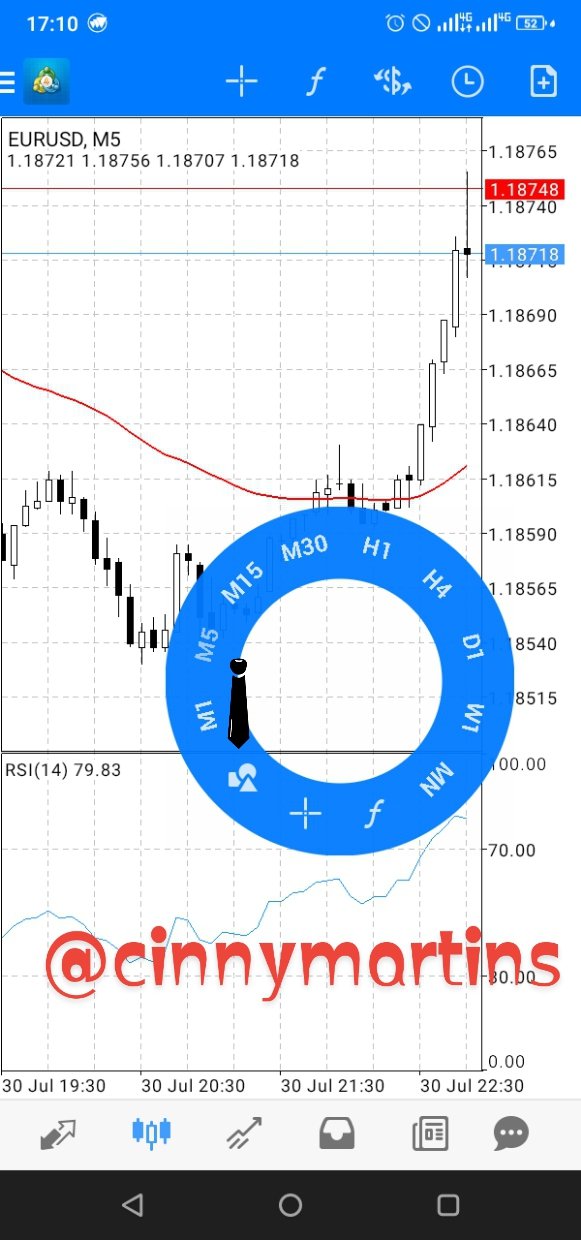
STEP 2: The pair I will be choosing to add my moving averages to is EUR/USD, so I will be clicking on the pair
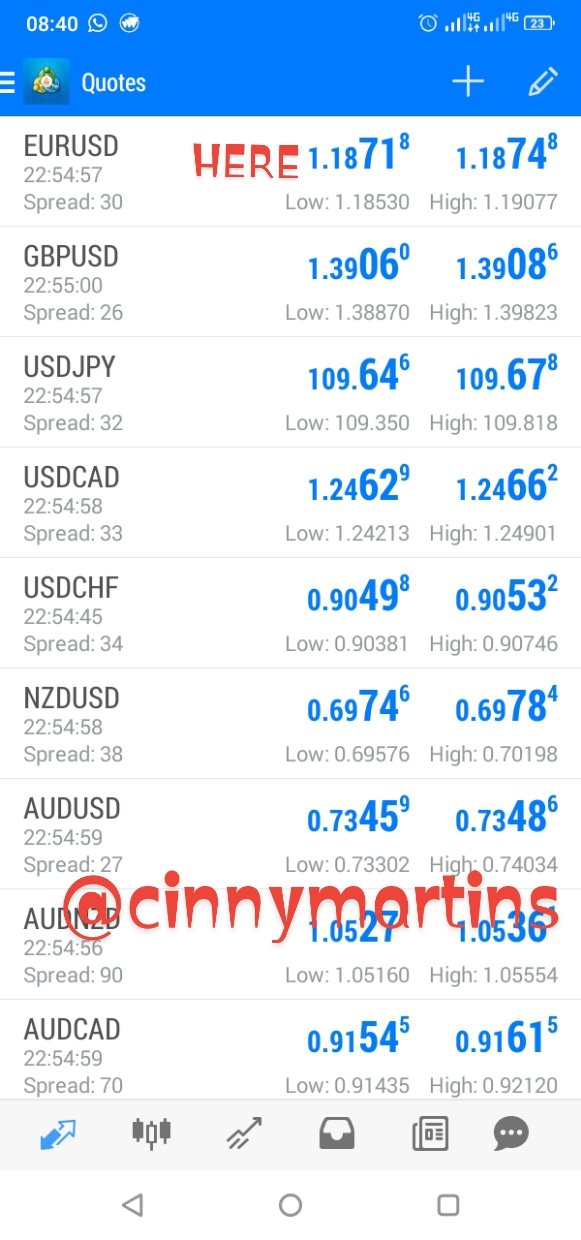
STEP 3: After clicking on the currency pair of my choice, the next thing that appeared was a chart showing the trend of the pair
And looking closely at the right hand side of the chart you will see an F icon. I clicked on it.
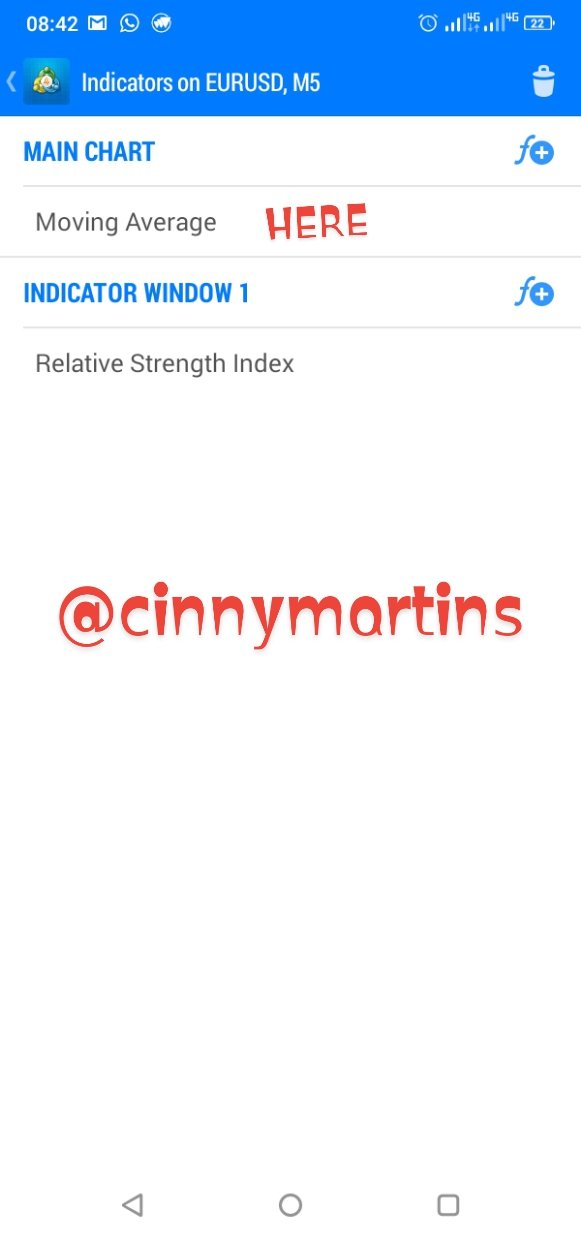
STEP 4: The next page that opened afterwards the trend indicator where I had to click at the moving Average
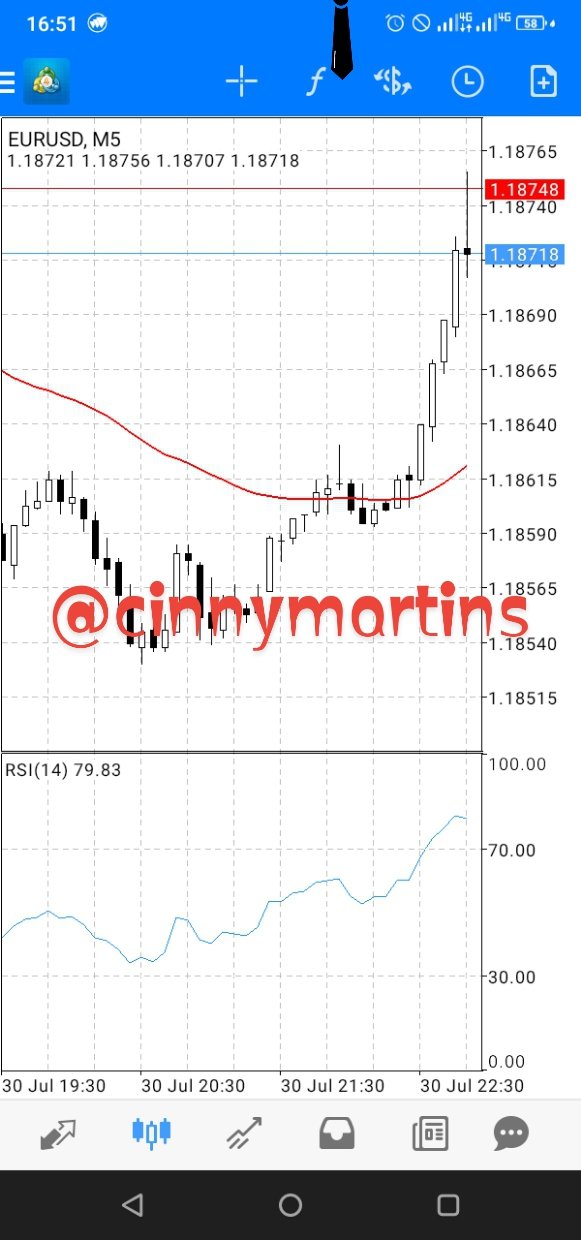
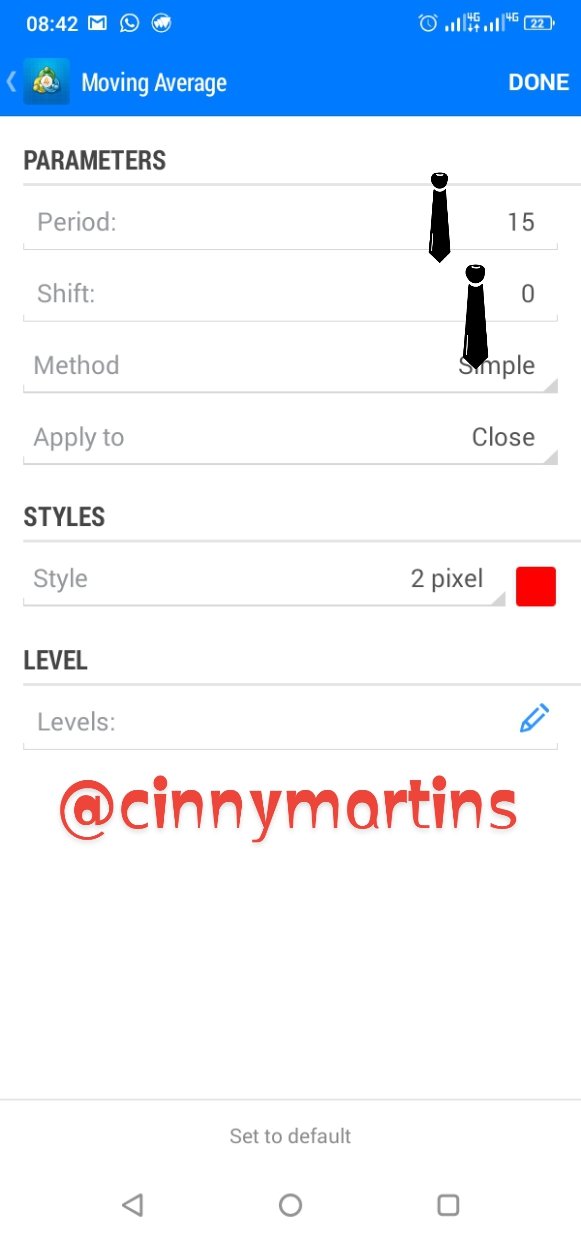
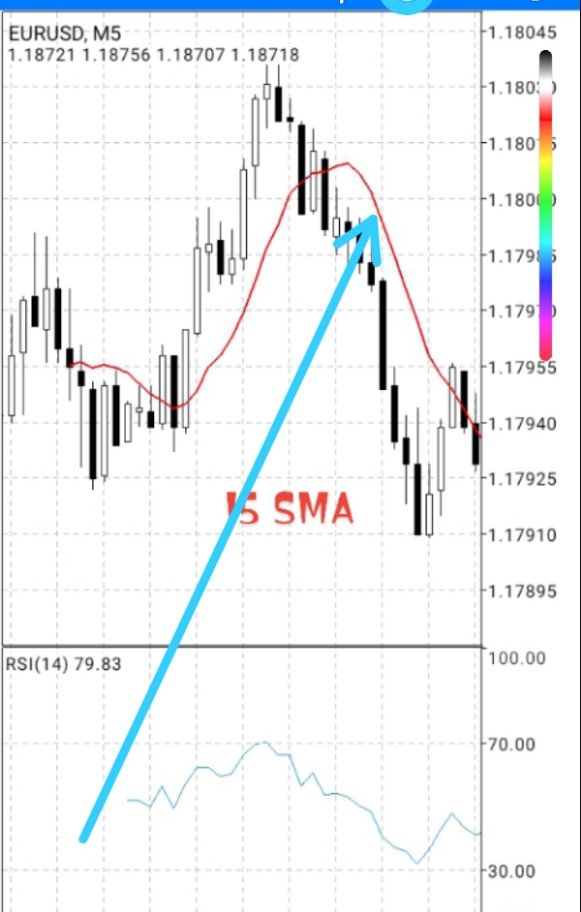
STEP 5 Then I clicked on simple moving Average on the new page and I selected 15 period based on my choice
And this is it reflection on the chart afterwards
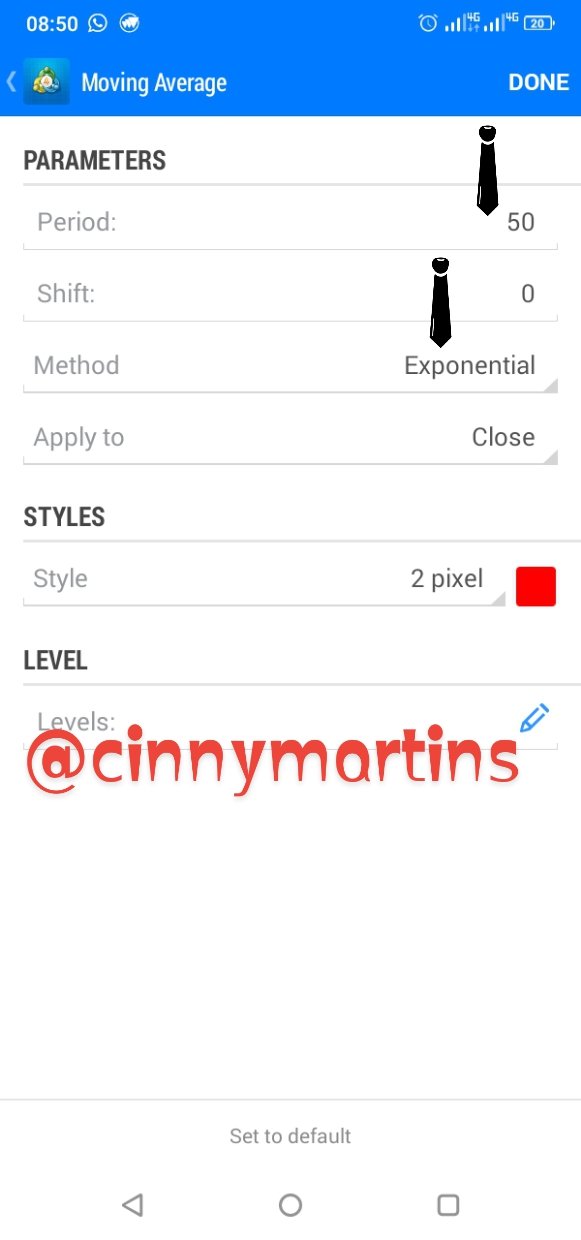
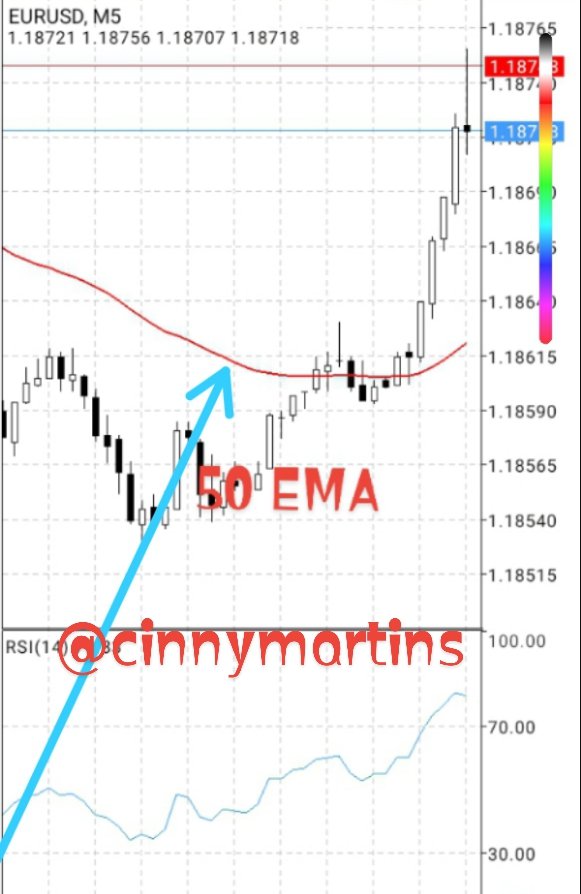
And I also went ahead to select exponential moving average and setting it on 50 period which is also my choice
And this was it's reflection on my chart as well
USE 'FIBONACCI RETRACEMENT' TO CHART A BULLISH AND BEARISH MOVE (OWN SCREENSHOT ONLY, NOTHING TAKEN FROM THE WEB)
STEP 1: To do this first I tapped on my chart and it navigated to where the Fibonacci retracement tool is and I clicked in it
STEP 2: And on the next page that opened, I clicked on the + icon
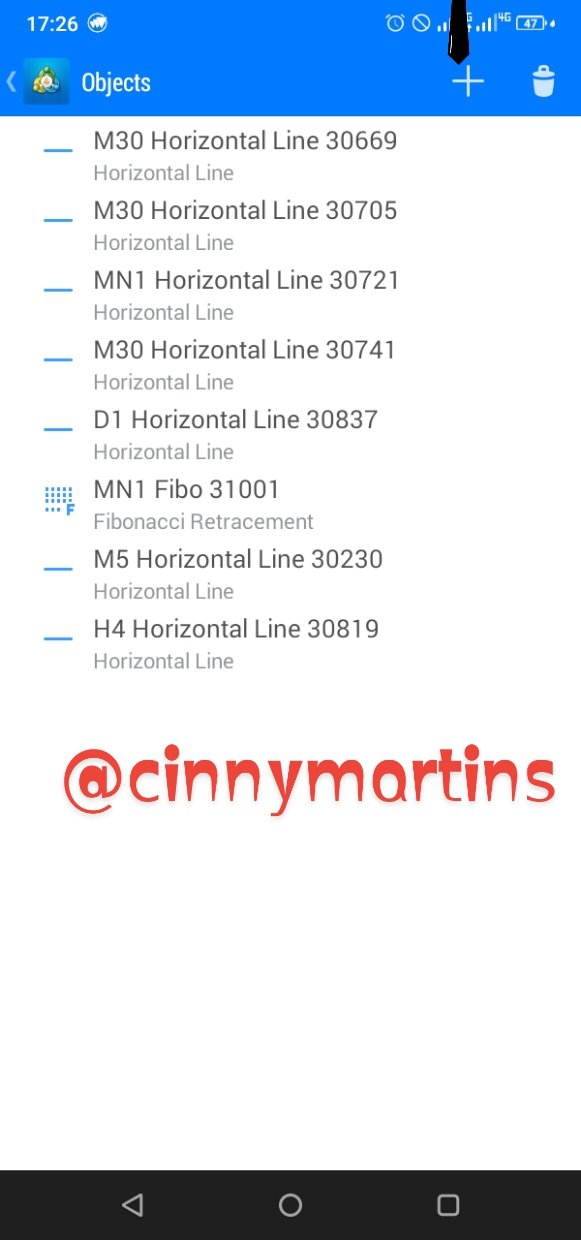
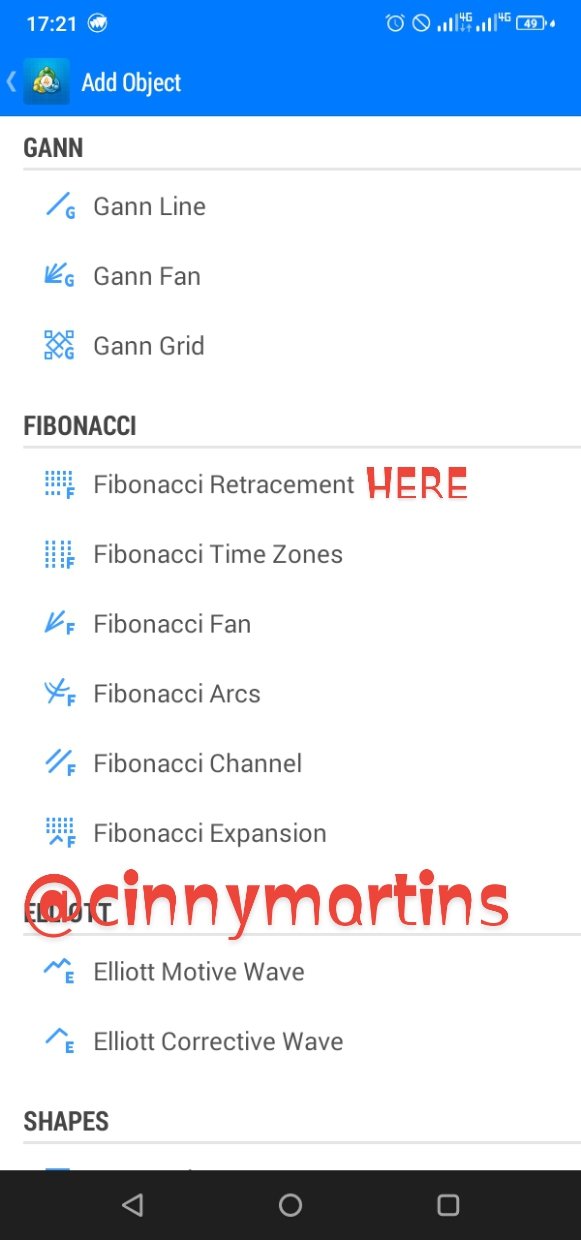
STEP 3: The next page that popped up was the as seen below and I had to make no change. So I clicked on Fibonacci retracement.
Before I go into charting a bullish and bearish move I will like to say that the term 'Bearish ' means a decline in price while 'Bullish' is the opposite.
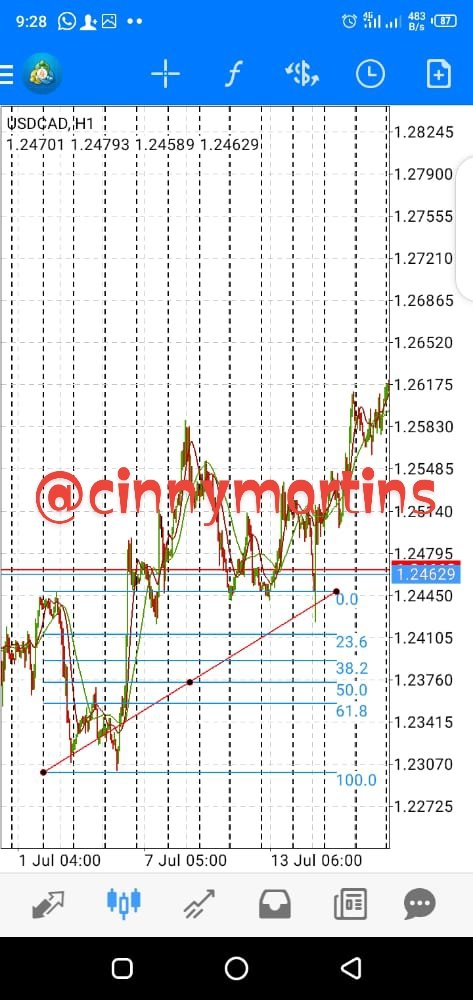
TO CHART A BULLISH MOVE
We drag from the lowest point to the highest point
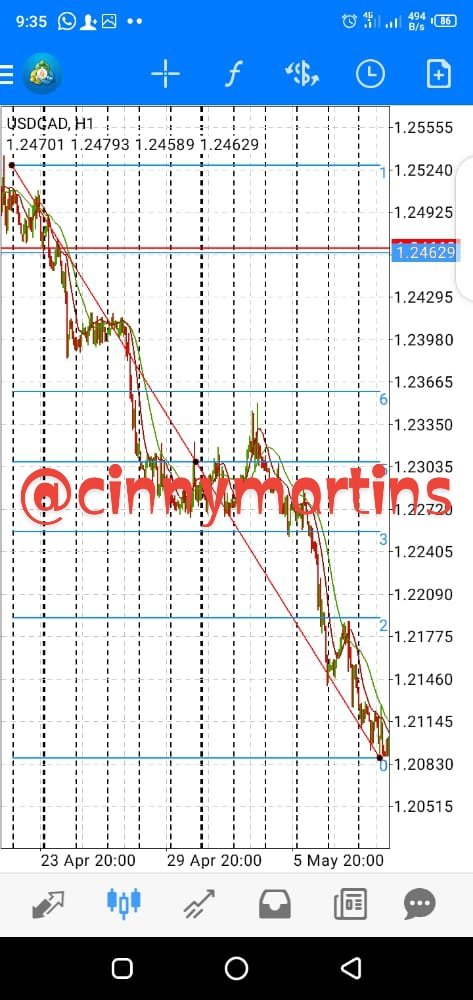
TO CHART A BEARISH MOVE
We draw from the highest to the lowest point as seen in the screenshot below
CONCLUSION
Moving Averages are used by traders to analyze and predict the price of a stock and it is of two types the simple and exponential moving averages.
Fibonacci retracement is an indicator tool used by traders to set prices and resistance levels and it is used for both bearish and bullish trend.