SteemitCryptoAcademy Season 3 Week 2 – Beginner Homework for @reminiscence01
.gif)
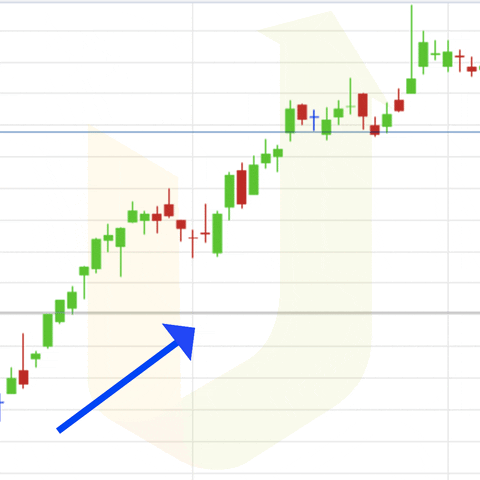
Image created in Canva
Greetings to everyone in the "SteemitCryptoAcademy" in this new season number 3, full of new knowledge thanks to the entire staff of teachers that make up the academy and that week after week bring us very interesting courses, I want to take the opportunity to also thank the Steemit team, for this incredible academy, I am really learning a lot, not only about trading, which is a topic that I have been interested in learning for some time, but about the Blockchain and the crypto ecosystem in general. Likewise, I will take the opportunity to do the homework of Professor @reminiscence01, which deals with a very important topic related to trading which are the "charts" and "Japanese Candles".
Nothing more to add. I will start immediately with my homework:


Before, explaining what a "Candlestick" chart is, I see it prudent to explain what a chart itself is and further explain what candlesticks are separately.
What is a Chart?
So, a chart in the world of trading, represents the movement and displacement that has the price, with respect to a particular asset, no matter what the asset is, the important thing is that, through this graphical representation, we as investors can see what the price does in real time, in short how the supply and demand behaves in that specific financial asset, in this case, we focus on cryptocurrencies.
What is a Japanese Candlestick?
The Japanese Candlesticks were created in Japan in the eighteenth century and is a technique used to study and analyze the movement that has the price, so it is a fundamental element, which we need to analyze and study what is a graph.
Now, since we know both concepts separately, I can define what is a Japanese Candlestick Chart below:
What is a Japanese Candlestick Chart?
A candlestick chart is an instrument used by investors and/or analysts to study and analyze the price movement in a certain period of time, using a very important element called "Candlesticks". These candlesticks are showing the strength of a movement and the battle between buyers and sellers, however, I must emphasize that this contest between both sides, both bidders and offerers, can be seen or represented in different time frames, so if, for example:
I am observing a 4 Hours chart, each candle is formed in this specific time, if, on the contrary, I see a 15 minutes chart, the candles will consequently take 15 minutes to form, it is already the trader's task to evaluate which time frame is better suited to his analysis, taking into account that, the higher this one is, the more reliability will have our study of analyzing the price by means of these candles.
Japanese candlesticks are represented on these charts in two ways, which I will describe now:

Bullish Candlestick
A bullish candle is usually represented by the color green or white, however, without giving much importance to the color of the candle, which can be perfectly customizable in the Broker or exchange that we use, what does matter is, both its opening price and its closing price, based on this we have that, for a candle to be bullish or we can identify it in this way, its closing price must always be above its opening price.
An example of a bullish candlestick:

Bearish candlestick
A bearish candlestick is usually represented by the color red or black and as in the bullish candlestick, it does not really matter the color, since, as I said, in any platform you can customize them to your liking, so, to identify it, the closing of a bearish candlestick, must always be below the opening one.
An example of a bearish candlestick:


The candlestick charts are not the only ones that exist in the trading world to analyze the price, there are also other types of elements and / or techniques that we can use to see the price movement and its path, in that sense, for this example, I will describe the following types of charts below:
Line Chart
This is the most basic chart that we can find in any trading platform, it is only represented by a simple line that helps us to visualize in a simpler way, which has been the displacement of the price. However, this type of graphs offer the investor a very basic analysis and study of the price and nothing detailed, so that, in it, we can only see and identify more clearly, which trend has the asset, but we can not get more information and detail of what is really happening in each period of time, which is very necessary to make a good investment decision.

Bar Chart
Bar charts are another technique and/or study that some investors prefer to use in their analysis, to study what is the behavior and/or the displacement that the price is doing. Unlike the line chart, this one offers more details of what is really happening in a given time period and in a specific area of the chart. Its formation is very similar to what are the "Japanese Candlesticks" and can be appreciated as follows:
Bullish Bar
To identify a bullish bar, we observe that it opens on the left side and closes above the opening price on the right side. See the following example in more detail:

Bearish Bar
To identify a bearish bar, we observe that likewise this makes its opening on the left side and its closing occurs below the opening price on the right side. See the following example in more detail:


The use of candlesticks is a very useful tool and/or technique, to be able to interpret accordingly what the price is doing at a given moment, in great detail. One of the main reasons why traders prefer to use the Japanese candlesticks, is because practically the price through these, speaks of what is happening in real time in the same, this is because we can know the following:
- When buyers are exerting a strong pressure to buy. When the price goes down and then rises very strongly, it leaves in its path a wick below the main body of the candlestick, its interpretation is that the buying force does not want to let the price continue to fall at a certain point, this can also be called candlestick patterns, specifically the hammer candlestick.

- On the other hand, we can know when the forces of both sides (buyers and sellers) are equalized, since, the price starts to sideways, forming what is known as a price range, since, the price actually moves in a range. At this stage we should refrain from investing to wait for a clearer trend movement.

- Another thing we can know with the Japanese candlesticks is the strength of a certain movement, in short, the strength of one of the sides, both buyers and sellers.


Bullish candlesticks
Bullish candlesticks, as I mentioned earlier, open below the closing price, indicating that the price has rallied with respect to that specific time frame and level. In summary, when a candle is just forming and it ends bullish, we have that the closing level is above the opening price, which leads us to say, that that candle was bullish, in short buyers dominated that session.
Example:

Bearish candlestick
Bearish candlesticks, as already mentioned, have their opening above the closing price, which indicates that, unlike the bullish candlestick, the price has suffered a fall, indicating that its value has fallen with respect to the time frame we are analyzing and at a specific level. In short, when a candle is forming and ends bearish, we have that the closing level, is below the opening price, which leads us to say that that particular candle was bearish, in short sellers dominated that session.
Example:

Interpretation and anatomy of a bullish or bearish candlestick
| Parts of a candle | Description |
|---|---|
| Open | The opening of a candlestick represents the beginning of its formation in a given period of time, in short, the price (value) at which it opens. |
| Close | The close of a candlestick represents the end of its formation in a given time period, in short, the price (value) at which it closed that session. |
| High | It represents the highest price reached in a given session, depending on the time frame being analyzed, in short it is the bullish wick, which leaves the candlestick, when the price reaches that level and then goes back down to the close. |
| Low | It represents the lowest price reached in a given session, depending on the time frame analyzed, in short it is the bearish wick, which leaves the candlestick when the price reaches that level and then goes back up to the close. |

To conclude this great task, first I must thank the teacher @reminiscence01 for this great lesson, referring to the graphics and one of the most used techniques in trading, such as Japanese candlesticks. I really increased my knowledge base on trading and the study of the graphs, besides being able to interpret more clearly what are all the components of a Japanese candlestick.
I hope you like my homework, blessings and happy learning.
.
Source
Screenshot Tradingview


Hello @cieliss, I’m glad you participated in the 2nd week of the Beginner’s class at the Steemit Crypto Academy. Your grades in this task are as follows:
Recommendation / Feedback:
You did an amazing work here. Your explanations are superb. Thank you for participating in this homework task.