Crypto Academy Week 16- Homework Task for Professor @Kouba01| Bollinger Bands|
Hello dear crypto friends, hope you will like my entry of the assignment given by professor @kouba01 . In this article, I desired to write on Bollinger band.
Define the Bollinger Bands indicator by explaining its calculation method, how does it work? and what is the best Bollinger Band setup?

Bollinger bands indicator is a price envelope that defines upper and lower price range levels plotted as a standard deviation. It's distance spread counting on standard deviation coupled with the underlying prices.
Bollinger Bands works with 2 parameters, standard deviation(StdDev) and as well with a period. And on the default state, the values for the period are set at 20 while that of standard deviation is at 2, although we can change the default settings to our preference.
Now, in explaining its calculation method, we first need to know or calculate this moving average before calculating the standard deviation over the same number of periods as the simple moving average. Now to get the actual value for the upper band we add the standard deviation to the moving average while that of the lower band is minus from the standard deviation from the moving average.
HOW IT WORKS
The bands move between the simple moving average and when its distance or gap is tightened it means the period of low volatility and there would be sharp price movement regarding the upper and lower bands. The period of trending move may start.
• The Separation of the Bands with a larger gap tends to indicate higher volatility hence this marks the ending of any existing trend.
• with this indicator if price breaks out from either the band's envelope, then we can take advantage of this tendency as its helps to identify potential profit target.
• we may have a lasting strong trend if the price moves out or break out of the Bands. But when the price Returns inside the band then it is reasonable to avoid taking profit any longer.
Best Setup to Use
Setting up Bollinger Bands may depend if you are intending to trade for a short time or for a long time. So when trading for a short time it is reasonable to set the moving average at 12 bars and then the standard deviation of 2. This setting is recommended if you are reading on Daily or weekly charts. Although you can choose the setting between 9-12 as suggested by John Bollinger.
What is a breakout and how do you determine it? (Screenshot required)
Breakout is when the price of an asset goes out of the support and resistance level on the Bollinger band and distance to show a new trend movement or Direction.
Now to determine a possible breakout using Bollinger bands. First, we need to study the Bands to know when it contracts or becomes tiny because this is when the bands indicate that the market is in low volatility. Hence the volatility naturally intends to expand or break out when the contraction starts ending. Study my screenshot below, I'm using the DOT/BUSD pairs as an example.
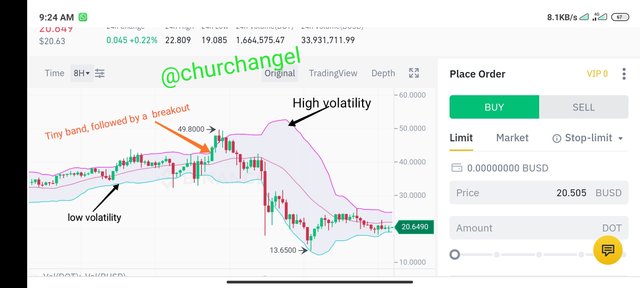
Again it is reasonable to know that the longer the volatility contracts, the stronger the next breakout will be.
How to use Bollinger bands with a trending market? (screenshot required)
When the market is trending, we can take advantage of the uptrend with the Bollinger band. The trader needs to study the chart so that to know when the band breaks out and as well, learn where the bands are moving. If the bands are moving up then it is a good time to Buy. Every trader will desire to earn profits from the uptrend before a reversal occurs.
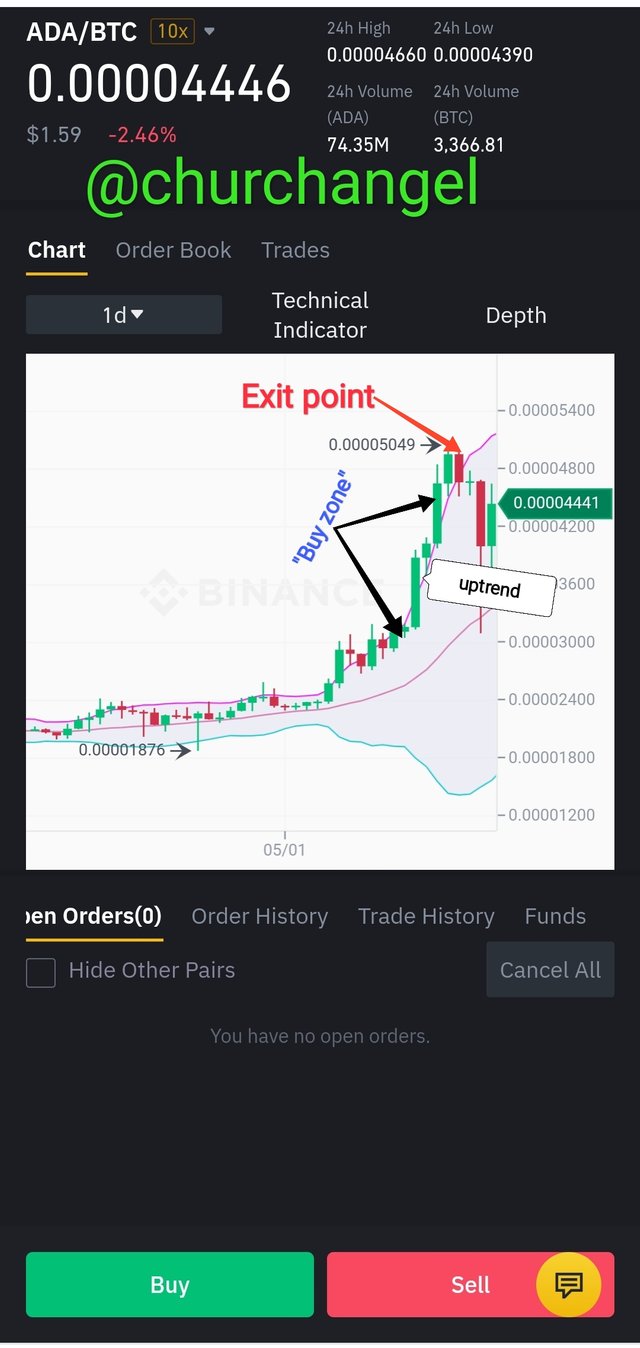
And when traders notice that the Bollinger Bands isn't reaching a new peak, then they tend to Sell the asset at this point to avoid losing from the reversed trend.
What is the best indicator to use with Bollinger Bands to make your trade more meaningful? (Screenshot required) (Screenshot required)
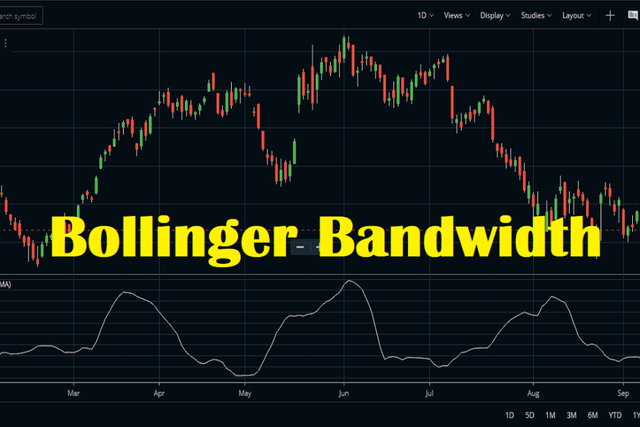
From the three well-known and accepted indicators which are the Bollinger Bandwidth indicator, BBTrend indicator, and the %b indicator, most traders like employing the Bandwidth indicator to use with Bollinger Bands. The justification of this choice is that this particular indicator exposes a comprehensive picture of the width between the upper and lower bands regarding the simple moving average.
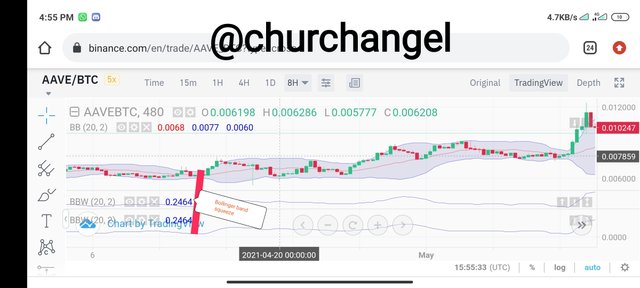
Having this in mind three days now work with this indicator and with that of Bollinger bands squeeze, to illustrate the degree to which the upper band and lower band are pressing against the simple moving average. Determining the squeeze requires that Traders will have to study closely all the three bands over a certain period. The number of squeezes is being calculated using a formula. We can use the number to estimate the direction of the assets being studied and the whole market as well.
What timeframe does the Bollinger Bands work best on?And why? (Screenshots required)
From observations, I will say that the swing trading time frame occurs to be the best when coupled with Bollinger bands. When a trade that desires to get a quick gain within some hour or minutes, then swings trading timeframes becomes an alternative.
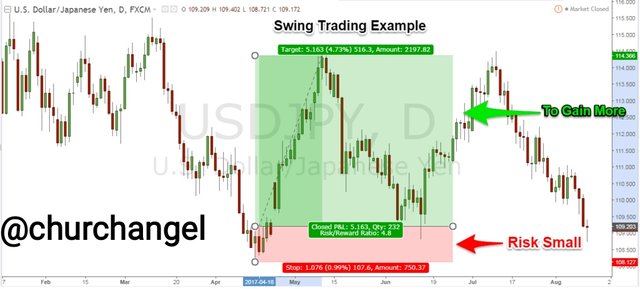
Like I said earlier it may be for an hour, a day, or a couple of days that a swing trader looks at the benefits one can derive from the market. Swing traders enter or exit the market on the same day or maybe a couple of hours.
Here is the reason why you should use swing trading time frames. With a swing, you will not lose much amount of your account balance for a potential more profit.
Review the chart of any pair and present the various signals giving by the indicator Bollinger Bands. (Screenshot required)
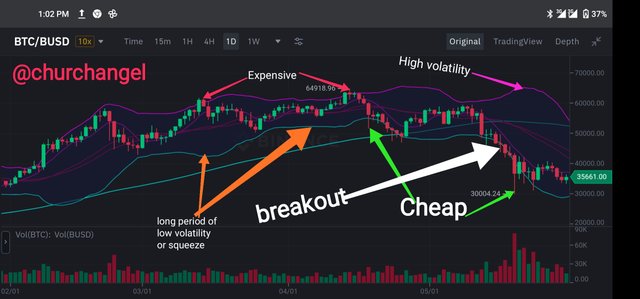
From the screenshot above we can observe so many signals through the help of the applied Bollinger bands. First, let's start with the "cheap" and "expensive" signals. When the price charge is near or out of the upper bands, it is known as expensive since it is 2 standard deviations above the average.
And when you notice the price chat to break out or near the lower Bollinger band, then it is recognized as "cheap". The cheap and expensive but us to know when to buy and sell.
Another signal here is this squeeze. The squeeze contract if there is low volatility and expand when the volatility is high. So with this signal, you can know when the market is at low or high volatility.
The last signal here is the Breakout you can identify the breakout while using the Bollinger bands so easily.
In conclusion, Bollinger bands are a simple but yet powerful tool to aid in Trading. This tool can help us to identify so many signals concerning the market and as well, boost Traders' knowledge concerning self-decision making if they know how to work with the bands.


Hello @churchangel,
Thank you for participating in the 8th Week Crypto Course in its second season and for your efforts to complete the suggested tasks, you deserve a 5/10 rating, according to the following scale:
My review :
An Average content in which you have tried to find the correct answer to the questions asked regarding the handling of the BB indicator. Most of them lack depth in analysis, we find dry answers without arguments that reinforce your point of view. Also, pay attention to your writing so as not to fall into the problem of spun content especially for the first parts.
Thanks again for your effort, and we look forward to reading your next work.
Sincerely,@kouba01
Nicely done