Head and Shoulders and Inverted Head and Shoulders Pattern- Steemit Crypto Academy- S5W2- Homework post for @utsavsaxena.
.png)

QUESTION 1:
Explain Head and Shoulder and Inverse Head and Shoulders patterns in details with the help of real examples. What is the importance of voulme in these patterns(Screenshot needed and try to explian in details)?
ANSWER 1:
Head and Shoulder
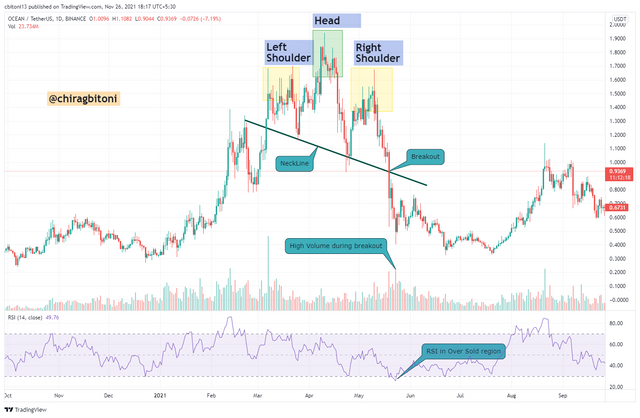
Head and shoulder pattern that is formed after an uptrend in the market and it usually represent reversal from an uptrend, The head and shoulder pattern contain three consistent peaks which has 2 outside peaks called shoulders and one inner peak which is the highest pumped peak called head or middle peak, the head is the highest pumped and the shoulders are less pumped from the middle peak, the correction formed by correcting the peaks is considered as neckline.
As the name says itself the head and shoulder pattern is consist of left shoulder one head and a right shoulder and a neckline. It also consist a neckline, It is depended over various factors that are volume, the breakout, price target and the support turned resistance.
Inverse Head and shoulder
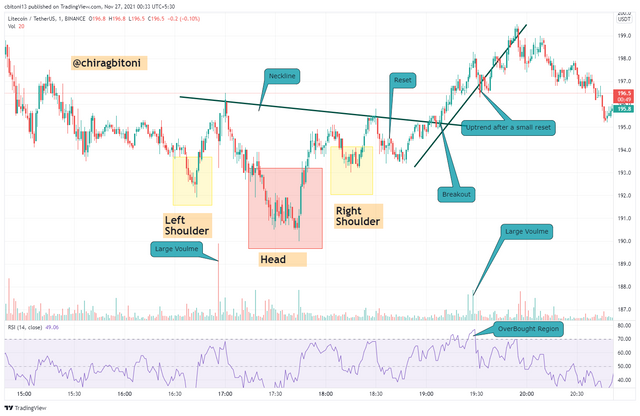
Let's talk about inverse head and shoulders, It is also called head and shoulders bottom, it is similar to the standard head and shoulder pattern, but inverted it predict reversal in downtrends, this pattern is seen after a downtrend in the market and it usually represent reversal from a down trend to uptrend, The inverse head and shoulder pattern consist of three downward dip which has 2 outside dip called shoulders and one inner dip which is the highest dip called head or middle dip, the head is the highest dumped and the shoulders are less dumped from the middle dip, the correction formed by correcting the peaks is considered as neckline.
Let's look towards the important parts which are required to build a head and shoulder pattern:
Prior trend: Prior trend is important to make peaks because without prior uptrend the trend would not be reversed and the initial peak will not get formed or we can say left shoulder will not be formed.
Left shoulder: the left shoulder get formed when a peak is formed that that marks a highest point of the prior trend, after peaking the decline formed completes the formation of the shoulder, the decline remains above the trend line, so that uptrend is kept intact.
Head: the more advanced form of trend which is formed after the left shoulder, it starts from the low of the left shoulder and advance begins that rise above the previous high and marks a top head, acter peaking the low of the decline marks the another point of the neckline. The low of the dip breaks the uptrend line.
Right Shoulder: The further peak from the low of the head forms the right shoulder. This peak is smaller than the head means it forms a lower high and usually rise with the height of left shoulder. Perfect head and shoulder consist of left and right shoulder of same height but it's a rare case, and now the decline or dip of the right shoulder should break the neckline.
Neckline: The neckline is drawn or we can say formed by joining the lower point of the left shoulder and the beginning of the head, depending on the relationship between the two low point, the neckline can be upward or downward or can be horizontal, the direction of the neckline will affect the pattern's degree of bearishness, the downward slope indicates bearish movement will be more bearish and the upward slope means less bearish.
Let's talk about the importance of volume in head and shoulder pattern.
As the head and shoulder pattern unfold, the volume level is used to confirm, we can measure the volume by some indicator like(OBV, Chaikin Money Flow) or simply by the volume indicator by analyzing the volume bar level, Mostly the volume before formation of of left shoulder is higher than the the beginning of the head, the mixed analysis of the of decrease in volume and the new high of head serve as a warning sign. The next panic situation get created when we see increase in volume when the head comes towards declination from the peak of the head, then the volume decreases during the beginning of the right shoulder, Finally it can be confirmed that the trend is reversed when we see increase in the volume at the declination from peak of right shoulder.
QUESTION 2:
What is the psychology of market in Head and Shoulder pattern and in Inverse Head and Shoulder pattern (Screenshot needed)?
ANSWER 2:
Let's look towards the psychology of the market head and shoulder pattern
As we have discussed above that in head and shoulder there are continuous up and down for the price in the market and due to this pattern market turns from upward to downward trending.
Before the first peak the market is usually side ways and then the uptrend starts as the uptrend starts the asset price moves up which creates a selling pressure and as the asset is sold in bulk due to this the price of the asset falls leads to the formation of left shoulder and as we know of the price of the asset is in dip that is the best time to buy and due to this buying pressure is created and people starts to buy the asset and due to the increase in trading volume the asset price rises again and as the price reaches at a certain high which is higher that the left shoulder people starts to sell the asset because most of the traders are scalpers and do short term trading so they book their profit and sell the asset and which leads to the declination in price movement and hence head is created and as the selling of the asset is continues at a certain level people starts to accumulate the asset again and again sell the asset which leads to the formation right shoulder and here the right shoulder height is lower and its creates a physiology that now the price isn't going to rise above the head again so the traders exit the market and sell the asset which created the reversal in upward trend and make the market downward trending.
Now let's see the market psychology for the pattern inverse head and shoulder.
As we have discussed above that in head and shoulder there are continuous up and down for the price in the market and due to this pattern market turns from downward to upward trending.
Initially the market is showing downward movement and as the selling volume increase the price of the asset starts decreasing and this once it reaches a certain dip where people starts to buy the dip the price starts to rise and dur to this reversal the left shoulder get created and price starts to rise and once the price by reaches approximately to the local resistance from where the previous dip starts the scalpers or short term traders starts to sell their asset and the price again fall and if the price fall below the left shoulder then after a certain time the buying pressure get creates as people try to accumulate the asset in low price and as the buying starts in the market the price again starts to rise up approximately to the local support region and then as the resistance zone is reached the price is at its lock resistance level the asset is begin sold and selling pressure is created among scalpers price again starts to fall and if the price doesn't fall below the head it means the inverse head and shoulder is formed and not we can expect a major downfall in the market and the price will fall further more so it's good to exit the market to minimize the loss.
QUESTION 3:
Explain 1 demo trade for Head and Shoulder and 1 demo trade for Inverse Head and shoulder pattern. Explain proper trading strategy in both patterns separately. Explain how you identified different levels in the trades in each pattern(Screenshot needed and you can use previous price charts in this question)?
ANSWER 3:
For the demo Trade I go through several Crypto currency chart and after a long time of surfing charts I finally able to found and and place the demo trade using the paper trading account on Trading View.
Head and Shoulder
For this demonstration I am using the pair MIR/USDT.
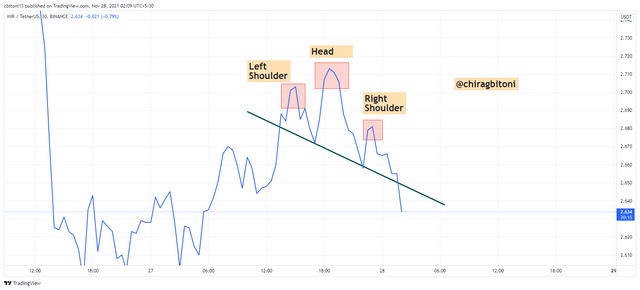
Here I place a demo sell order off 100 MIR token in exchange of USDT, once the Head and shoulder formed completely and now we can expect a major downfall.
.png)
Inverse Head and Shoulder
For this demonstration I am using the pair BTC/USDT.
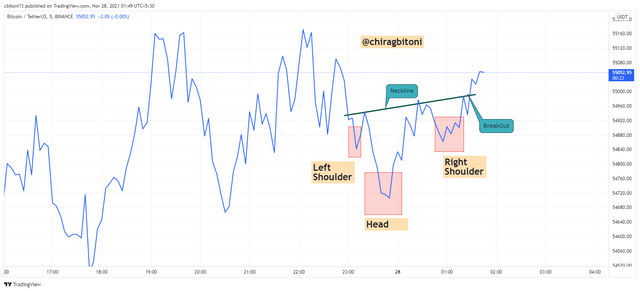
Here I place a demo buy order off 100 BTC token in exchange of USDT, once the Inverse Head and shoulder formed completely and now we can expect a major uptrend.
.png)
QUESTION 4:
Place 1 real trade for Head and Shoulder(atleast $10) OR 1 trade for Inverse Head and Shoulder pattern(atleast $10) in your verified exchange account. Explain proper trading strategy and provide screenshots of price chart at the entry and at the end of trade also provide screenshot of trade details.(Screenshot needed.)
ANSWER 4:
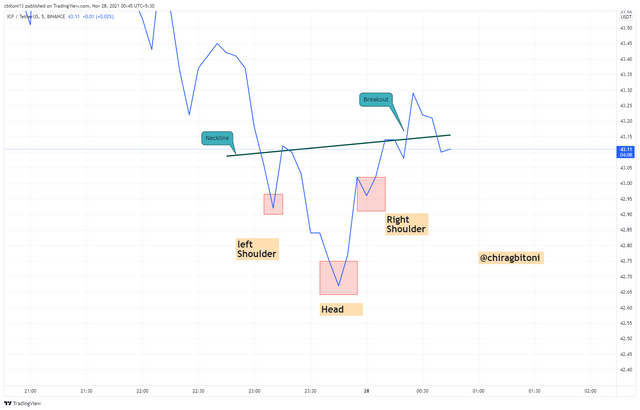
As i go through different charts, I found a inverse head and shoulder pattern formed on the pair ICP/USDT and the Project of ICP token is also strong hence I placed a buy order once the breakout is confirmed using the gate.io Exchange as our professor @utsavsaxena11 love the exchange Gate.io.
Let's see the steps of placing the buy order:
- *Step 1: Check for the available pairs of asset ICP and check that it was in you wallet or not.
.png)
- Step 2: Here we can see we have approx. 3800 INR worth of ICP which is equivalent to approx. $51 and now we will go the spot trading and place a buy order of ICP against USDT, using the limit order type, here i entered the amount of USDT I want to exchange in exchange of ICP and confirmed the order.
.png)
.png)
- Step 3: Now the asset will get visible in our exchange wallet once our limit order get fulfilled.
.png)
Conclusion
The head and shoulder pattern is the most common formation that shows reversal after it's formation, It is seen that it forms after an uptrend and usually makes a major trend reversal when it completely forms, This pattern can be use for a signal to exit the market.
The inverse head and shoulder is the believed to be the downward reversal pattern and once it get formed, We can mostly notice that a downward trending market get reversed into a upending market and it can be used to enter the market.