Double Top and Wedge Trading - Crypto Academy S6W2 - Homework Post for @imagen
.png)

QUESTION 1:
Explain in your own words the concept of Double Top, Double Bottom and Wedges. How to interpret each one?
ANSWER 1:
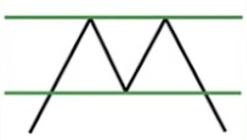
Double Top
Double top is a market price pattern formed in a price chart of a asset, it is formed by occurance of two continuous edging tops. The pattern is also recognised by a M pattern, This pattern basically indicates that the next behaviour of the market will mostly going to be bearish or we can say these M patterns are the bearish reversal as they are formed after a bullish trend. Usually the second top peak is slightly little bit below the first top peak, when the first top peak formed it forms a resistance and if the price bounce back from the resistance line then the double top pattern is formed and then traders try to sell their position as the price will go down. After the formation of double top the traders try to sell their position and will try to entry the market again when price drops.
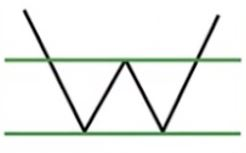
Double Bottom
Double bottom is a market price pattern formed in a price chart of a asset, it is formed by occurance of two continuous edging bottoms. The pattern is also recognised by a W pattern, This pattern basically indicates that the next behaviour of the market will mostly going to be bullish or we can say these W patterns are the bullish reversal as they are formed after a bearish trend. Usually the second bottom peak is slightly little bit above the first bottom peak, when the first bott peak formed it forms a support line and if the price bounce back from the support line then the double bottom pattern is formed and then traders try to buy their position as the price will go up. After the formation of double bottom the traders try to buy their position and will try to exit the market again when price rises.
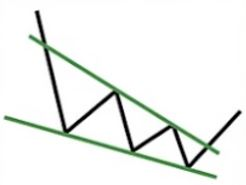
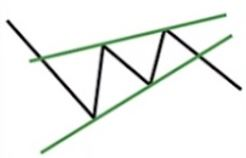
Wedge
A wedge is a price pattern formed on crypto price chart, it got formed when the price line/ candle, these pattern are identified by connecting two trend lines by connecting highs and lows of the price trend. There are two types of wedges called falling and rising wedgesz these lines gives the look as a wedge as soon as the trend line converges. Wedge are a indicator that indicated a trend reversal in the market, A wedge pattern can indicate a price reversal wheather it is bullish or bearish. If the pattern fulfill the characteristics that are as follows first is the converging trend lines then second is the volume decrease as the price line progresses through the pattern and the third is the breakout of it from one of the converging trend line, here we have a rising wedge which indicates a bearish reversal and falling wedge which indicates a bullish reversal.
QUESTION 2:
Main differences between the Double Top and the Double Bottom. Show screenshots.
ANSWER 2:
| Double Top | Double Bottom |
|---|---|
| A double top pattern is a bearish reversal chart pattern formed after an uptrend. | A double bottom pattern is a bullish reversal chart pattern formed after the downtrend. |
| Double Top pattern is formed with two top peaks above its support line which considered as the neckline. | Double Bottom pattern is formed with two lows below its resistance level which is considered as the neckline. |
| The first peak is formed after a strong uptrend and then correct come back to the neckline. | The first low is formed after a strong downtrend and then the prices correct back to the neckline. |
| After bouncing back to its neckline, the price becomes bullish and rises to form the second peak. | After bouncing back to its neckline, the price becomes bearish and falls to form the second low. |
| The formation of double top pattern is completely formed when the prices move back to the neckline after forming the second top peak. | The formation of double bottom pattern is completed when the prices move back to the neckline after forming the second bottom low. |
| When the prices break out through the neckline/the support level then the bearish trend reversal is on it’s way. | When the prices break out through the neckline/the resistance level then the bullish trend reversal is on it’s way. |
QUESTION 3:
Explain and highlight the main differences between a bullish wedge and a bearish wedge. Show screenshots of each.
ANSWER 3:
Bearish Wedge : When Two converging lines are slanted downward. It get mostly forms after a major downtrend and indicates a potential bullish reversal in the previous downtrend. Moreover, it may also appear in an uptrend, in that case, it indicates a likely continuation of that previous trend. Either way, Falling Wedge typically results in a bullish breakout. Falling Wedge tends to be a more reliable indicator than a rising wedge.
When price breakouts the upper trend line the price is expected to be bullish. Emerging patterns (before a breakout happenss) can be traded by swing traders between the converging lines, however, most traders should wait for a completed pattern with a breakout and then place a buy order at the breakout.
Bullish Wedge : When two converging lines are slanted upward. It will mostly forms after an uptrend but it can also occur wjile a downtrend. It can be seen usually decrease volume as the price rises through the pattern (i.e. price/volume divergence). Rising wedge typically results in a downward breakdown (bearish).
Emerging patterns (before a breakout occurs) can be traded by scalpers traders between the converging trend lines; however, most traders should wait for a completed pattern formation with a breakout and then place a sell order.
QUESTION 4:
Explain the volatility that usually exists with respect to the volume in the wedges. When is there usually more volume? What happens if a pullback breaks the support of a wedge?
ANSWER 4:
Wedge patter is formed when a break out from the current trend in the market. This pattern forms when the volume in the trend starts to decrease. This formation may when traders exit their positions from the market.
As the wedges formed then the market, these's some uncertainity in the market and the next move is unpredictable as there's volatility in the market, this leads to decrease in the volume in the price of the asset. While this pattern is forming and the price moves in between the converging trend line and we can see the higher volume during th breakout in the wedge pattern.
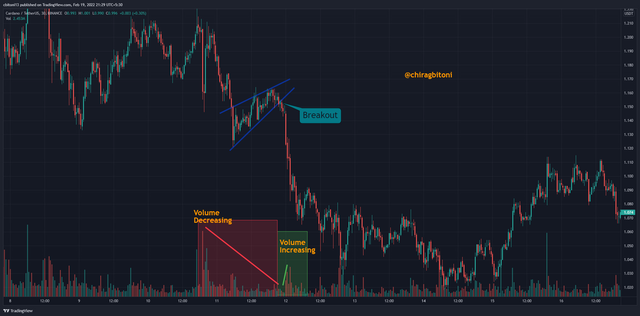
In the above chart of ADA/USDT, we can see the low volume during the formation of the pattern and as the breakout occur these's a increase in the volume.
Whenever a pullback breaks the support of a wedge, it indicates that selling pressure is more in the market and this leads other traders to exit their position, although this can be made by big whales and in this case we call this a fakeout, as big Wales want to but in lowest price and make profit, In wedge pattern next movement is pridicted by the previous trend in most of the cases, In bearish market when a wedge is formed it is most likely to follow the same trend i.e. the support line is going to break and bearish move will continue, In bullish market when a wedge is formed, it is most likely to follow the same trend i.e. the resistance line is going to break and bullish move will continue, The trader must keep remembering that this breakout can be a fake out also, so he must confirm the move and then take a action.
QUESTION 5:
Find and analyze the double top pattern on at least 2 charts. Show your own screenshots.
ANSWER 5:
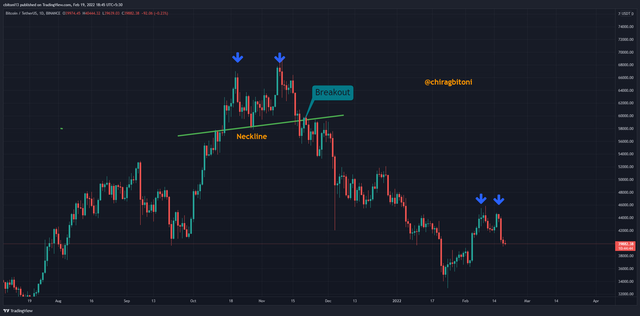
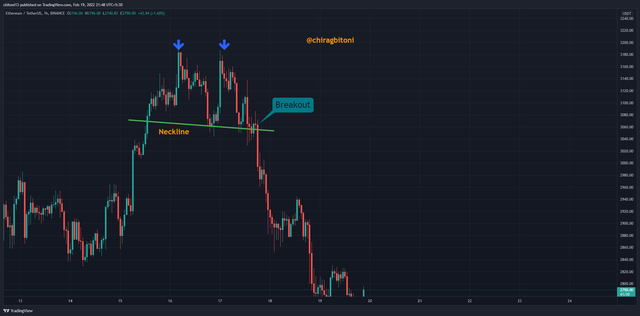
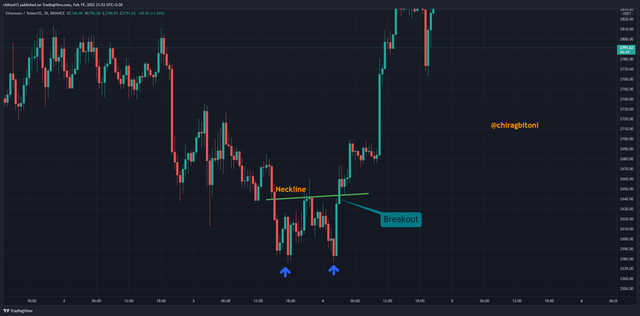
In the above chart of BTC/USDT with 1 Day Time Frame, we can see a double top formation in the month between October and December, We can see there's two top peak are formd on after the other and we created a neckline as the price reversal occurs at the second top there,s double top formation and traders exit their positions in the market and the price falls and lead to bearish movement in the market, and it breakes the neckline which is the confirmation of the reversal pattern and now we can exit the market, And when we look at the current market movement we can see there's a new initial formation of double top pattern.
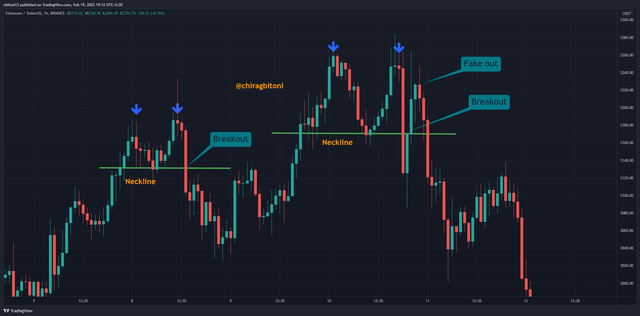
In the above chart of ETH/USDT with 1 HOUR Time Frame, we can see two double top formation in the this month of feb on days between 7 feb and 12 feb, In both pattern we can see there's two top peak are formd on after the other and we created a neckline as the price reversal occurs at the second top there,s double top formation and traders exit their positions in the market and the price falls and lead to bearish movement in the market, and In the second pattern we can see a major fakeout which most likely created by whales to trap small traders.
QUESTION 6:
Find and analyze at least 2 rising wedges and 2 falling wedges on at least 2 charts. Show your own screenshots.
ANSWER 6:
Rising Wedge
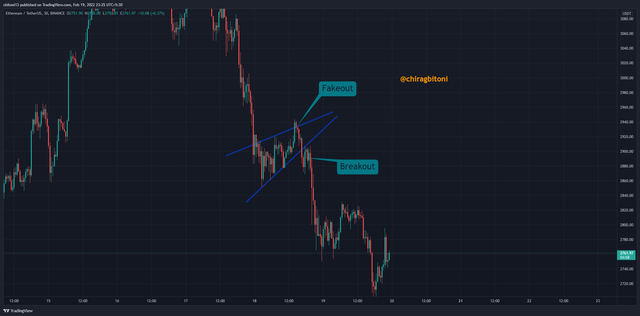
In the above chart of ETH/USDT, initially the price is moving downward and showing a bearish move with a very high volume and then after that price try to show reversal many times, where we can draw two converging trend and while the price moves in between these trend line the volume keeps decreasing and then eventually the price breaks the resistance line and which further can be seen that it was a fakeout and then price breaks the support line and further moves downward with a high volume.
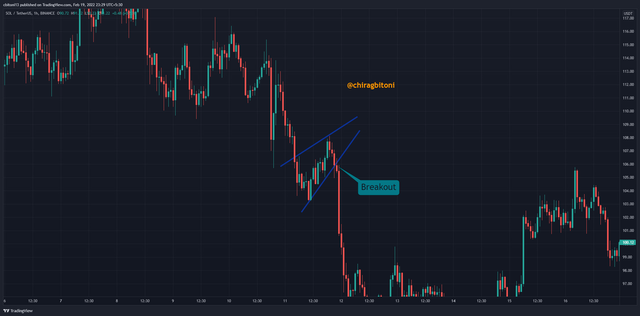
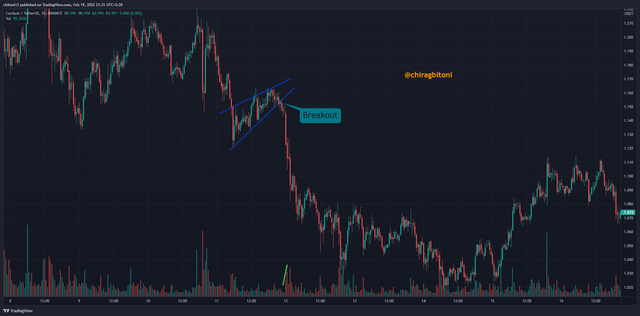
In the above chart of SOL/USDT, initially the price is moving downward and showing a bearish move with a very high volume and then after that price try to show reversal many times, where we can draw two converging trend and then the price breaks the support line and further moves downward with a high volume.
Falling Wedge
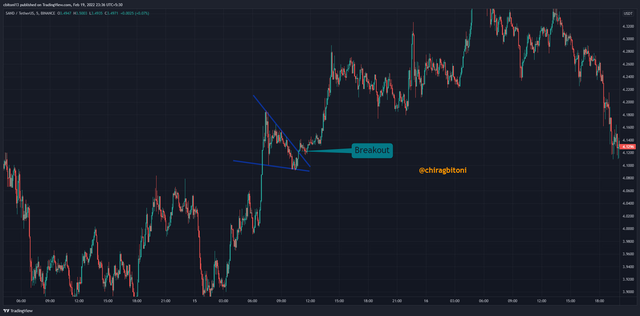
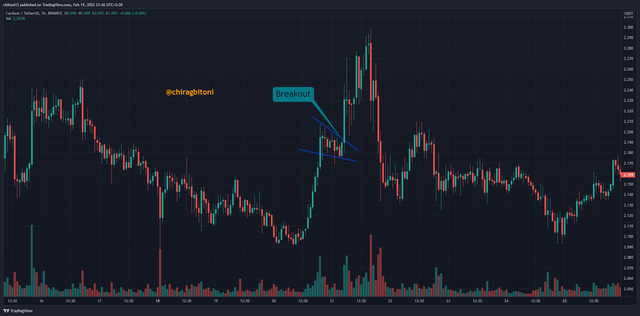
In the above chart of SAND/USDT, we can see initial price is moving upward and showing bullish move with a very high voitality/ volume and after that price show come corrections and show several reversal and if we draw a 2 trend lines we can see they are converging and as they break the upper resistance line it moves upward with a high volume.
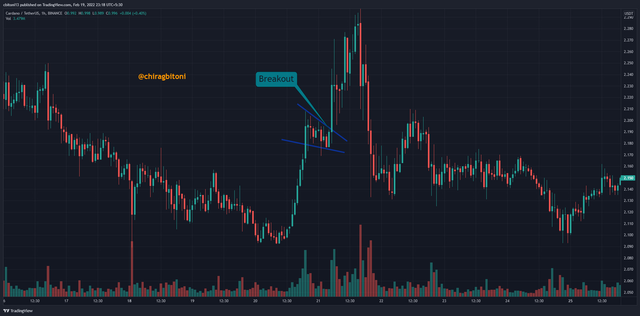
In the above chart of ADA/USDT, we can see initial price is moving upward and showing bullish move with a very high voitality/ volume and after that price show come corrections and show several reversal and if we draw a 2 trend lines we can see they are converging and as they break the upper resistance line it moves upward with a high volume.
QUESTION 7:
Importance of patterns in technical trading.
ANSWER 7:
In technical analysis the pattern formed by the price candlestick or line chart plays a crutial rule in predicting the next move of price in the market. In technical analysis we see the current and previous movement of the price to analyse the market behaviour, The chart patterns are considered as the most successful price pridiction tool.
The chart pattern help a trader to analyse the emotions and physiology of other traders who are trading in that market. It helps a trader to analyse better where buying and selling pressure is more. We can analyse the support and resistance in the chart through the pattern formed in the market. Through the chart patterns the trader can analyse the price reversal and price continuation in future.
Although trader should not fully depend on the chart patterns as there are many fakeout that are created by big whales to put a trader in a trap, trader should also do fundamental analysis as well as he should use various indicator along with it to confirm the price pridiction.
Through all this a trader can analyse where to enter and where to exit in the market, for example, a trader saw a double bottom formation in the market and he should confirm this trend reversal through various indicator such as volume and RSI where volume should Increase and RSI should be in over bought region.
QUESTION 8:
Do you find it effective to use these patterns in trading? Justify your answer.
ANSWER 8:
Patterns plays a crutial role in the market as these pattern are considered by most of the traders which means other traders are also act accordingly with the as per the pattern formed in the market, however these patterns are also used by big whales to create a fakeout in the market to trap a trader and they can make a big profit, these patterns are very effective in trading tokens, although sometimes these patterns doesn't follow the trend as per it is intended to follow after a pattern formation.
These patterns are effective and mostly the price follow the trend as per a it is intended to follow after a pattern formation, But we should not only depend on single pattern, we should use different indicators along with it to confirm the next move of the market, for example: when a double top is formed in the market and the volume is decreasing and once it reaches the neckline of double top the volume indicator should show a large increase in the volume and RSI should be in oversold region, hence through all this we can confirm a price trend after a pattern formation.
Conclusion
Double top is a bearish reversal pattern, it is formed by simultaneous occurance of two edeging top, it is a M pattern, after this pattern the next trend of the market will be bearish.
Double bottom is a bullish reversal pattern, it is formed by simultaneous occurance of two edeging bottom, it is a W pattern, after this pattern the next trend of the market will be bullish.
Wedges is a kind of pattern, this pattern is formed when we connect trend line by connecting highs and lows and they are converging, there are two types of wedges that are falling wedge and rising wedges.
Chart pattern help a trader to predict the next movement of the market and he can take decision accordingly but a trader should not fully depend upon pattern, the combination of fundamental analysis and technical indicator are also used in the prediction of the next move of the market.
Gracias por participar en la Sexta Temporada de la Steemit Crypto Academy.
Espero seguir corrigiendo tus futuras asignaciones, un saludo.