Crypto Academy / Season 3 / Week 8 - Homework Post for @cryptokraze | Trading Sharkfin Pattern
.png)

QUESTION 1:
What is your understanding of Sharkfin Patterns. Give Examples (Clear Charts Needed).
ANSWER 1:
V Sharkfin patterns are formed when a market forms a quick reversal after a major uptrend or a major downtrend in the market. Due to this a V pattern is formed which seems like a fin of shark whether it is inverted or normal, If the sharkfin pattern is formed as a shape of normal V it is called normal V Sharkfin pattern and If it forms an inverted V then it is calles inverted V Sharkfin pattern, Normal V Sharkfin pattern is formed when market is following a downtrend and then it shows a reversal with the same intensity as of downtrend and similarly Inverted V Sharkfin pattern is formed when market is following a uptrend and then it shows a reversal with the same intensity as of uptrend.
Example of Normal V sharkfin Pattern:
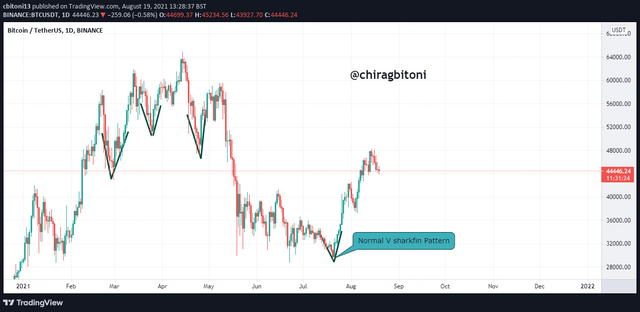
Here we can see different normal v sharkfin patterns these patterns are formed due to trend reversal after a major downtrend and with the almost similar intensity as of previous downtrend.
Example of Inverted V sharkfin Pattern:
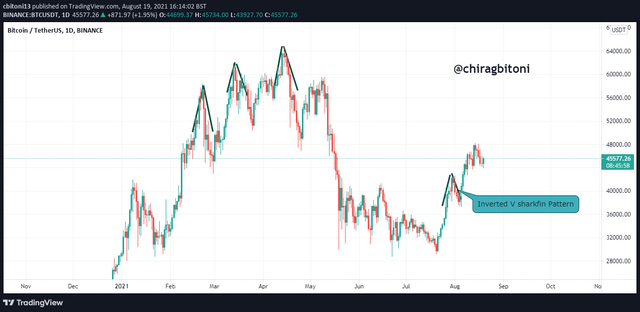
Here we can see different lnverted v sharkfin patterns these patterns are formed due to trend reversal after a major uptrend and with the almost similar intensity as of previous uptrend.
QUESTION 2:
Implement RSI indicator to spot sharkfin patterns. (Clear Charts Needed).
ANSWER 2:
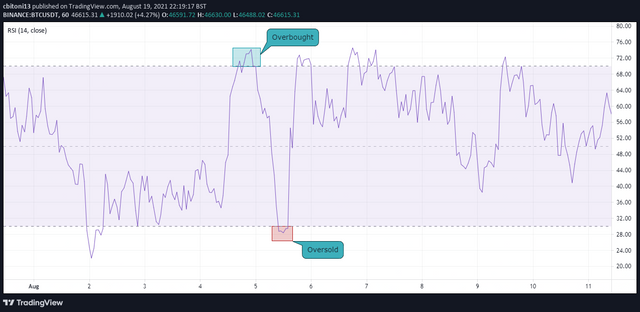
What is RSI and how it works :
RSI stands for Relative Strength Index and it is a momentum oscillator that indicates the momentum in the price, Its value remains between 0-100, the zone in between 0-50 is considered as bearish zone and the 50-100 is considered as bullish zone. If the RSI value is above 70 then it is considered that the asset is overbought and if the RSI value is below 30 then it is considered that the asset is oversold, If value rise above 80 it is considered as extreme overbought and id the value is below 20 it is considered as extreme oversold, When the value of RSI is around 50 then the market moves sideways.
There is a misconception among new traders that as soon as value rise above 70 they thought that the asset is already overbought and he start to sold their asset to take the profit but this is not true, because if the value just start to rise above 70 means the asset is just started to overbought in the market and the price will start to rise at a higher rate from now, and as soon as value fall below 30 they thought the asset is already oversold and he will start to buy the asset and enter the market but this is not true because if the value just start to fall below 70 means the asset is just started to oversold in the market and the price will start to fall at a higher rate.
Due to these above discussed reason the traders got stuck in the market and can loose their money.
Let's see how to use RSI to spot sharkfin patterns.
Normal V sharkfin Pattern.
A Normal V sharkfin pattern is generally seen when the RSI value comes in the oversold region and then again got out of the oversold region which creates a reversal in the market and the downtrend in the market gets reversed which creates a normal v sharkfin pattern.
Example
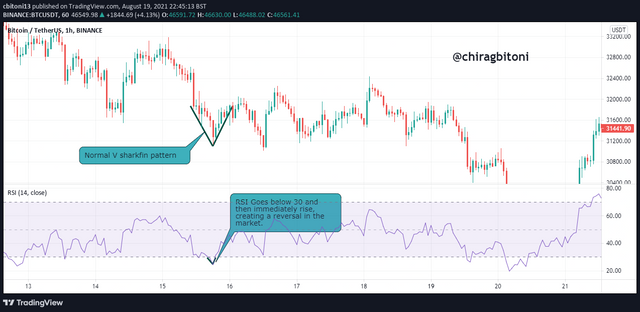
In the above chart of BTCUSDT we can see initially the market is following downtrend as the RSI indicator is going towards the oversold region, as the RSI indicator shows reversal and immediately the market also reverse creating the normal V sharkfin pattern.
lnverted V sharkfin Pattern.
A Inverted V sharkfin pattern is generally seen when the RSI value comes in the overbought region and then again got out of the overbought region which creates a reversal in the market and the uptrend in the market gets reversed which creates a lnverted v sharkfin pattern.
Example
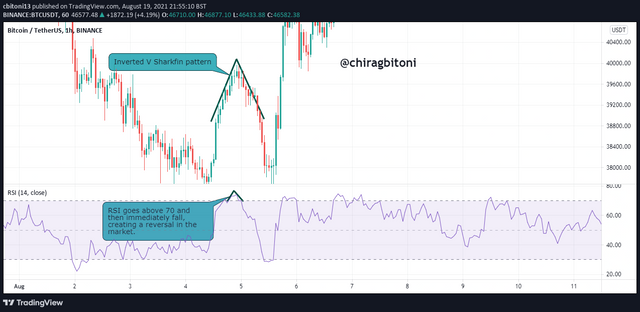
In the above chart of BTCUSDT we can see initially the market is following uptrend as the RSI indicator is going towards the overbought region, as the RSI indicator shows reversal and immediately the market also reverse creating the lnverted V sharkfin pattern.
QUESTION 3:
Write the trade entry and exit criteria to trade sharkfin pattern (Clear Charts Needed).
ANSWER 3:
Let's begin with our entry strategy in the market using the RSI indicator.
- First of all we need to spot a downtrend which is result after a reversal from a uptrend market.
- We need to wait for the RSI indicator to fall below the value of 30 (reach the oversold region).
- If the value of RSI again rise above the value of 30 and continues to rise, we should enter the market.
- Use the 50% risk reward ratio.
Example
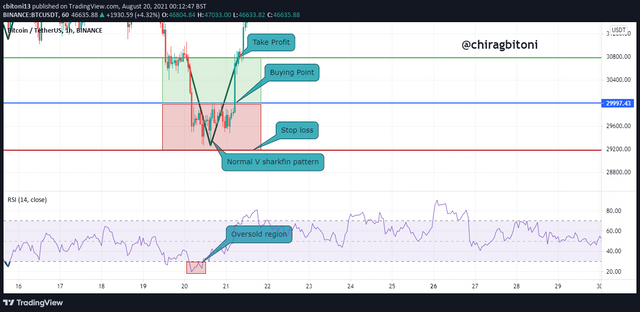
In the above chart of BTCUSDT we can see that the market is following a downtrend and and as the market enter the oversold zone people start to buy the asset as RSI indicated that asset is already oversold now it's on its resistance line or low price so people start to buy using this signal, now due to this buying pressure the market start to show reversal now as the RSI again leave the oversold region we can enter the market and I would prefer to use a 50% risk reward ratio.
Now Let's begin with our exit strategy in the market using the RSI indicator.
- First of all we need to spot a uptrend which is result after a reversal from a downtrend market.
- We need to wait for the RSI indicator to rise above the value of 70 (reach the overbought region).
- If the value of RSI again fall below the value of 70 and continues to fall, we should exit the market.
- Use the 50% risk reward ratio.
Example
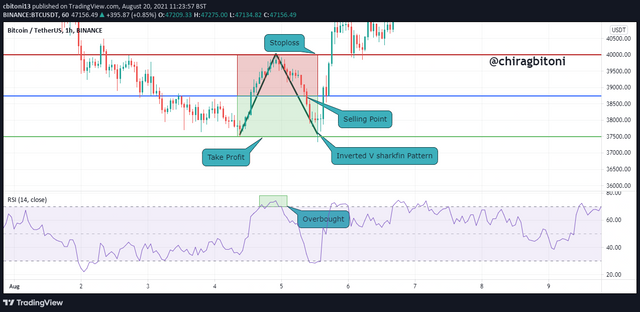
In the above chart of BTCUSDT we can see that the market is following a uptrend and and as the market enter the overbought zone people start to buy the asset as RSI indicated that asset is already overbought now it's on its support line or high price so people start to sell using this signal, now due to this selling pressure the market start to show reversal now as the RSI again leave the overbought region we can exit the market and I would prefer to use a 50% risk reward ratio.
QUESTION 4:
Place at least 2 trades based on sharkfin pattern strategy (Need to actually place trades in demo account along with Clear Charts).
ANSWER 4:
For this demonstration first I choose the AVAXUSDT pair with 1 min time frame because i want to do this trade as soon as possible.
First of all I use AVAXUSDT to enter the market with 100 tokens.
For this I tried to spot a downtrend with the RSI value falling below the value of 30, after happening of this I wait for the quick reversal of the RSI line to rise above the mark of 30, then after that i entered the market with a amount of 100 tokens, I set take profit and stop loss at a risk reward ratio of 50%.
.png)
I entered the market at price 35.712 and set a risk reward ratio of 50%, I placed take profit at 36.129 and stop loss at 35.272, As time passes it hit the take profit.
.png)
Let's try to sold 100 tokens of AVAXUSDT.
For this I tried to spot a uptrend with the RSI value rising above the value of 70, after happening of this I wait for the quick reversal of the RSI line to rise below the mark of 70, then after that I exit the market with a amount of 100 tokens, I set take profit and stop loss at a risk reward ratio of 50%.
.png)
I exit the market at price 36.128 and set a risk reward ratio of 50%, I placed take profit at 35.632 and stop loss at 36.633, As time passes it hit the stoploss.
.png)
Conclusion
Sharkfin pattern are formed when the market is following a trend and then quickly it shows a reverse trend and due to that trend reversal a V shape pattern is formed which seems like a sharkfin that's why it is named Sharkfin pattern, there are two types of sharkfin pattern one is normal Sharkfin pattern and another is inverted sharkfin pattern, normal Sharkfin pattern is formed when a downtrend shows a reversal and the reversal is of almost same intensity as of previous downtrend due to this a normal V is formed, Inverted sharkfin pattern is formed when a uptrend shows a reversal and the reversal is of almost same intensity as of previous uptrend due to this an inverted V is formed. RSI indicator is used to trade the sharkfin pattern because using RSI correctly can tell us when the trend is going to show reversal and hence we can trade accordingly.
You have been upvoted by @sapwood, a Country Representative from INDIA. We are voting with the Steemit Community Curator @steemcurator07 account to support the newcomers coming into Steemit.
Engagement is essential to foster a sense of community. Therefore we would request our members to visit each other's posts and make insightful comments.
Thank you