Crypto Academy / Season 3 / Week 4 - Homework Post for @asaj | Spotting Market Reversals With CCI

QUESTION 1:
Open a demo account on any trading broker and select five cryptocurrency pairs.
ANSWER 1:
Usually I do trading on the Binance exchange but as asked by professor i am using the trading panel called paper trading on trading view as a demo account for trading.
To Start Paper trading on Trading View Let's see the steps required.
- Step 1: In the trading view website click the trading panel option on thee bottom menu bar.
.png)
- Step 2: Click the Paper Trading and Click Connect.
.png)
- Step 3: Now Confirm the same by clicking connect.
.png)
- Step 4: Now our demo account is created and our demo trading is ready to go.
.png)
- Step 5: On the right menu you can place buy and sell order by entering the quantity, limit price etc.
.png)
- Step 6: After placing the order you can see the order history in the bottom bar.
.png)
The 5 crypto assets that I am using for this demonstration are
| BAT | MATIC | TRX | BNB | RUNE |
|---|---|---|---|---|
| Basic Attention Token | Polygon | TRON | Binance coin | THORChain |
 |  |  |  | |
| Image Source | Image Source | Image Source | Image Source | Image Source |
QUESTION 2:
Create a market entry and exit strategy.
ANSWER 2:
To Create a market entry and exit strategy I am using the Moving Average set at Length 10 and Length 30 and the CCI Indicator.
Buying/Entry Strategy.
The CCI indicator value should lie below the -100 zone.
.png)
Whenever Moving average intersect the candle stick and the candle sticks start to rise above the moving average line and then a new fresh candle stick start without intersecting the moving average and lie above the moving average we will enter the market.
Selling/Exit Strategy.
The CCI indicator value should lie above the +100 zone.
.png)
Whenever Moving average intersect he candle stick and the candle stick start to lie below the moving average line and then a new fresh candle stick start without intersecting the moving average and lie below the moving average we will exit the market.
Example Of Buy and Sell Using Moving Average Indicator.
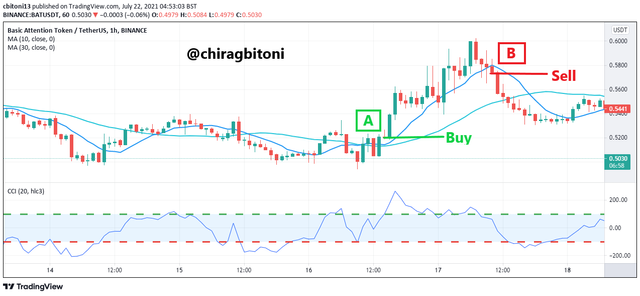
Example of Buy and Sell using Moving Average Indicator Just before point A the moving average indicator intersects the candle stick and at point A fresh candle stick start without intersecting and floating above the moving average indicator.
Just Before point B the moving average indicator intersects the candle stick and at point B fresh candle stick start without intersecting and lie below the moving average indicator.
QUESTION 3:
Use the signals of the Commodity Channel Index (CCI) to buy and sell the coins you have selected.
ANSWER 3:
Entry Strategy.
To find a entry point I waited for the CCI index to fall below the -100 level and then look at the moving average to intersect the candle stick and then wait for the fresh candle stick to fall below the candle stick.
Exit Strategy.
To Find a exit point I waited for the CCI index to rise above the +100 level and then look at the moving average line to intersect the candle stick and then wait for the fresh candle stick to rise above the candle stick.
TRX/USDT.
I made a Entry at the market at the price 0.05409 and at CCI -216.98, I purchased this for total 5.409 USD.
.png)
I made a Exit at the market at the price 0.05440 and at CCI 229.74, I Sold this for total for 5.440 USD.
.png)
MATIC/USDT.
I made a Entry at the market at the price 0.90607 and at CCI -184.37, I purchased this for total 90.607 USD.
.png)
I made a Exit at the market at the price 0.91337 and at CCI 274.63, I Sold this for total for 91.337 USD.
.png)
BAT/USDT.
I made a Entry at the market at the price 0.5087 with 100 Token at CCI -254.87 and then made a Entry at the market at the price 0.5032 with 200 token at CCI -201.13 , I purchased this for total 151.51 USD.
.png)
I made a Exit at the market at the price 0.5013 and at CCI 168.18, I Sold this for total for 150.39 USD.
.png)
BNB/USDT.
I made a Entry at the market at the price 294.55 with 100 tokens at CCI -120.20, I purchased this for total 29455 USD.
.png)
I made a Exit at the market at the price 295.49 and at CCI 106.2, I Sold this for total for 29549 USD.
.png)
RUNE/USDT.
I made a Entry at the market at the price 4.641 with 100 tokens at CCI -91.6, I purchased this for total 464.1 USD.
.png)
I made a Entry at the market at the price 4.682 with 100 tokens at CCI 158.43, I purchased this for total 468.2 USD.
.png)
QUESTION 4:
Declare your profit or loss
ANSWER 4:
.png)
TRX/USDT.
Entry Price=5.409USD.
Exit Price=5.440USD.
Return=5.440-5.409=0.031USD.
Profit=0.031USD.
MATIC/USDT.
Entry Price=90.607USD.
Exit Price=91.337USD.
Return=91.337-90.607=0.73USD.
Profit=0.73USD.
BAT/USDT.
Entry Price=151.51USD.
Exit Price=150.39USD.
Return=150.39-151.51=-1.12USD.
Loss=1.12USD.
BNB/USDT.
Entry Price=29455USD.
Exit Price=29549USD.
Return=29549-29455=94USD.
Profit=94USD.
RUNE/USDT.
Entry Price=464.1USD.
Exit Price=468.2USD.
Return=468.2-464.1=4.1USD.
Profit=4.1USD.
Total Profit=0.031+0.73+94+4.1= 98.861USD.
Total Loss=1.12USD.
QUESTION 5:
Explain your trade management technique
ANSWER 5:
Trade management technique can vary from person to person, I personally use the binance exchange to do trade, I keep many factors in my mind such as technical analysis, news in the market about that asset, fundamental analysis, project behind the asset.
To manage Trade and minimize the loss, I use the MA indicator and whenever the candle stick intersect the MA indicator line and the next fresh candle stick starts from above the MA indicator line, I enter the market and then I add a stop loss order to sell the asset if it reaches the price I want it to sold then it will automatically gets sold to minimize the loss and risk, If I can do a manual trade then I wait for the MA indicator line to intersect again and then wait foe the next fresh candle stick to fall below the MA indicator the I sell the asset in order to minimize the loss or to generate the profit.
Conclusion
While Doing Research on regarding this homework I have learnt many new things, Now I know how we can use the CCI indicator in order to know that particular asset is overbought or oversold and by this we can do our entry and exit in the market, I Tried this CCI indicator with the Moving Average Indicator in order to stay away from the Divergence in the CCI indicator because I personally think using 2 indicator at a time helps the trader to better predict the trend of the market. Thank you professor @asaj for this simple and easy to understandable lecture.
Superb performance @chiragbiton!
Thanks for performing the above task in the fourth week of Steemit Crypto Academy Season 3. The time and effort put into this work is appreciated. Hence, you have scored 9 out of 10. Here are the details:
Remarks:
Nicely done Chirag! I noticed you were averaging down your position in the BATUSDT trade. The price kept falling and you made an attempt to minimise
your loss. Had you waited for just 37 minutes, you could have made a profit.
You sold BAT at 11:08 for 0.5013 USD when CCI first reached the overbought territory. At 11:20 the price fell to 0.4980 USD and the CCI entered the oversold territory. That was your cue to make another buy order. And, at 11:45 its price rallied up to 0.5060 USD which would have made good profit for you.
Overall, you did an excellent job. Keep it up!
Thank you professor for reviewing and appreciating my work.