SteemitCryptoAcademy Week 14 - Homework Post for @fendit -Elliott Wave Theory.
Thank you, amiable professor, @fendit. Your lectures are one which I always look forward to and I am glad to be doing this homework. Thank you for always simplifying your lessons.
What's the application of this theory?
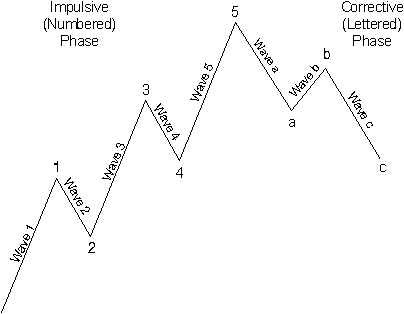
ELLIOT WAVE THEORY
Source
This simply is a theory in technical analysis that is used to describe price movements in the financial market related to changes in the sentiment and psychology of investors. This theory shows both impulse and correct waves; the impulse sets up a pattern while the corrective waves oppose the trend. This theory was proposed by Ralph Elliot after he observed recurring fractal wave patterns. In the financial market, it is believed that ‘whatever goes up must come down and it is upon this truth that the Elliot wave theory is established.
APPLICATION OF ELLIOT WAVE THEORY
This theory is vital for investors in cryptocurrency who want to maximize the profitability of their assets. It is used to identify the direction of the market trend, the rise, and the fall of prices of cryptocurrency in line with the sentiment and psychology of the investors. It is a great tool used in enhancing trading strategy, it is used in the identification of stop-losses and to forecast the strength of the market moves. It goes perfectly well when combined with MACD and RSI indicators as they define the entry and exit points for investors (when to enter the market and make purchases and when to leave with profits). It is used to trade in short periods because the psychological impulse is not long-lasting. We do not exactly expect this analysis to be 100% foolproof and, however, it will help investors set price targets in their trading.
What are impulse and corrective waves? How can you easily spot the different waves?
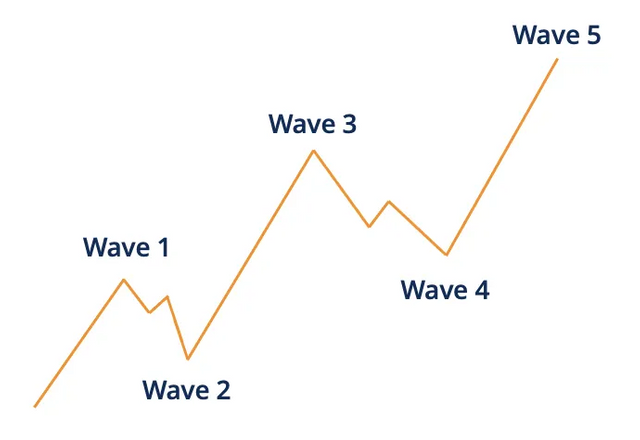
Impulse waves
Source
Impulse waves are a concept that shows the movement in a financial instrument’s price. It goes with the major market’s trend. It consists of five separate sub-waves and shows very large price variations. Impulse waves run in a direction close to the pattern and are not limited to a fixed span of time and can last for several hours, years or decades.
We can identify them by comparing the length, start, and end of each with the following basic rule.
Rules for identification of impulse waves
- Wave 2 cannot trace more than 100% or the beginning of wave 1
- Wave 3 can never be the smallest between waves 1, 3, and 5…this is because it usually is the longest.
- Wave 4 can not coincide with wave 1
- The remedial waves (waves 2 and 4) do not interfere with each other.
- Wave 5 has to end with momentum divergence
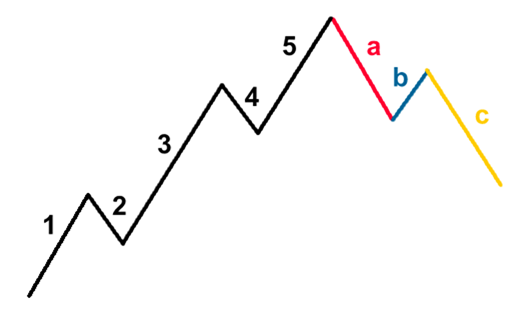
Corrective waves
Source
Corrective waves are labeled a, b, and c
These are waves that move against the trend at one larger degree and consist of three sub-waves. They are less clearly identifiable as compared to impulse waves.
There are three kinds of corrective patterns and can be identified as such;
- Zigzag
- Flat
- Triangle
Zigzag: It is a corrective 3 waves structure and occurs when the trend cannot be corrected readily. Wave B is always shorter than A and C; and the price goes slightly up, as it is a bit difficult to go against the trend at first.
Flat: It is a 3 waves corrective move labeled ABC. It is easier to spot and the waves will likely all have the same length.
Triangle: This formation is really hard to spot because attention must be paid to the A, B, and C of the previous points When this happens, it means that volatility and volume are decreasing.
What are your thoughts on this theory? Why?
My opinion about this theory is that it is a good one and we can take advantage of it to make good profits although we have to study it very well to know when the wave starts when to buy and when to sell. Personally, I think if we can correctly find wave 3 at its beginning, a lot of profits and very low stop-loss will be made when it gets to its peak and the same applies to point B, it is also a time to make some profit.
We must also understand that this is still a ‘theory’ and as such, is bound to be inaccurate and fail and hence, we must perform our technical analysis perfectly, and most importantly we must perform all the steps at least in small sections. One important thing to note is setting a stop loss at the lowest point of purchase.
However, I feel the challenge lies in knowing where the beginning of the wave lies and where it stops as I had this challenge while trying to analyze my coin chart. Notwithstanding, it gives an opportunity to be able to predict the market trend and not make a lot of mistakes.
Choose a coin chart in which you were able to spot all impulse and correct waves and explain in detail what you see. Screenshots are required and make sure you name which cryptocurrency you're analyzing.
This chart shows the impulse and corrective waves in BTC/USDT in an interval of 3days, it was carried out from the Binance exchange.
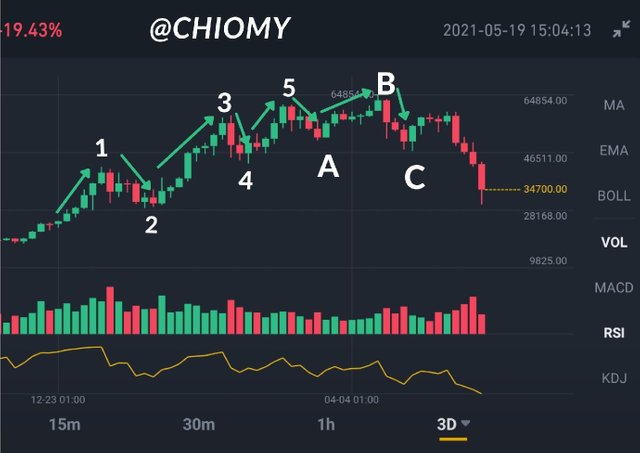
This occurred on the 19th of May, 2021 and according to my analysis, wave 1 happened at about $40,000 and a very small purchase of the coin by investors was observed.
Thereafter, there was a drop in price which could actually mean that investors may be skeptical about the market and that is why we have wave 2 at about $29,000.
Remember that the whole idea of Elliot wave theory is based on the emotions of investors and this was clearly seen in wave 3 where there was a high rise in price at $50,000, it actually seemed like everybody wanted to buy/sell and there was FOMO at this point. Wave 3 is actually the longest of them all.
The whole tension had reduced and it showed a steep drop in price at wave 4 at about $45,000 and then it increases again to its highest level which may be the all-time high in wave 5 at $62,000 and boom, the correction happens. The corrective waves set in at A which is given by a correction due to the outgoing of buyers on the rise, and when it reaches the lowest point. Again, it increases at B where investors purchase a lot again with the fear of missing out on the profits without knowing that a great fall in wave C is coming.
Conclusion
I have learned quite some lessons from this theory and I’m sure it will help me in technical analysis and price forecasting. I can clearly differentiate between impulse and corrective waves. I feel like the Elliot theory has come to stay because we humans are emotional beings and as long as we remain intuitive, impulsive, and repetitive, the Elliot wave theory will always be effective.
Cc: @fendit
Disregarded as it contains plagiarized content
@sapwood
Thank you so much.
I will update it in the sheet.