Steemit Crypto Academy Season 2-Week4 - Cryptocurrency Trading with RSI Submitted by @chinto1
Is been a great pleasure to be part of this week crypto assignment by our hardworking crypto professor @kouba01. I have learn a lot from this week assignment, as I do every week. I will like to answer the questions, one after the other so as to provide clear and simple answers to the questions.
Question 1: What is the relative strength index-RSI and how it is calculated?
Brief history of relative strength index (RSI): it was invented by an American mechanical engineer called j. welles wilder jnr, In the year 1978. He invented many other indicators such as RSI, ATR,
Relative strength index is a technical oscillator that measure momentum thus, the price variation of assets. It measure the change in price of stock as to either overbought or oversold of assets. This give traders the chance to determine when to buy an entry. The RSI oscillator has a line graph that move between two extreme. With the use of the chart pattern, a trader will know when it is overbought or oversold in the cryptocurrency market.
How relative strength index is calculated
There are so many ways to calculate RSI, but as a beginner I will to like to use the simple approach.
RSI= 100-100/ (1 +RS)
In the formula, RS is equals to average price gain over a period/ average price lose over a period.
Question 2: Can we trust the RSI on cryptocurrency trading and why?
Yes, relative strength index in cryptocurrency trading can be trusted. Because, RSI has an indicator that show overbought or oversold extremes over a period of time. RSI is automatically set-up to show that when it is over 70% implies that the asset is overbought, and when the asset is at 30% also means that it oversold. This indicate that the RSI crytocurrency graphs show the uptrend and the downtrend of the assets when trading. Oversold and overbought in this context means extreme sell/buy, and as such, make the indicator a reliable technical indicator place a good buy or sell. Some caution should be put in place to make sure that the uptrend direction uses the RSI indicator.
Question 3: How do we configure the RSI indicator on the chart and what does the length parameters? Why is it equal to 14 by default? Can we change? (Screen capture required)
Steps to configure the RSI indicator is as follows,
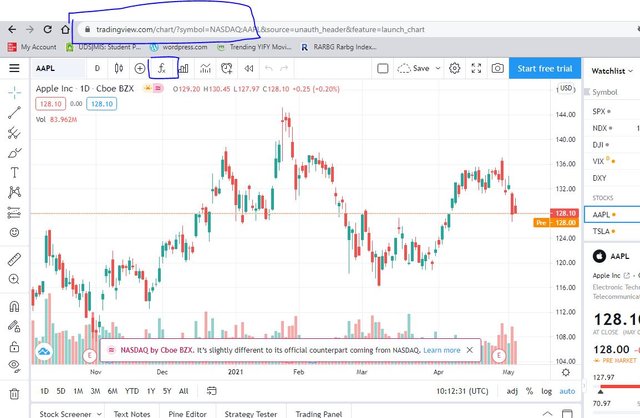
There are so many of these platforms used to analyze the RSI, but I have chosen to use the tradingview.com
After logging into the platform, you open a chart and then select the fx button as indicated in the sceenshot
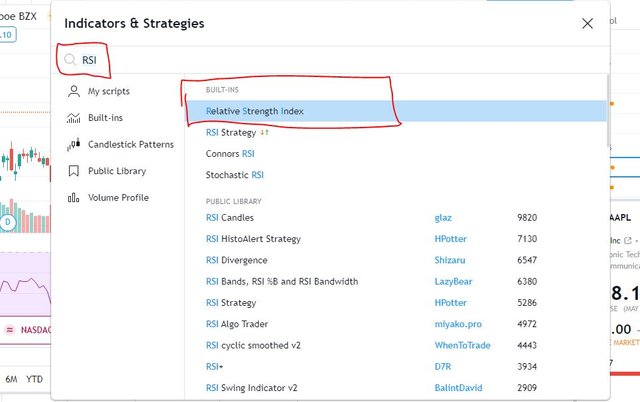
After selecting the fx button, you will have to type RSI in the search box and then select the RSI in the list that is given you as shown in the image below
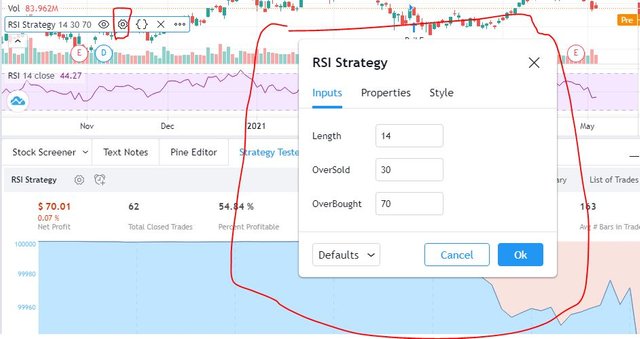
Configuring it, it comes below the price chart and if you want to access the custom window you will have to click on its corresponding settings is which I will highlight in the settings
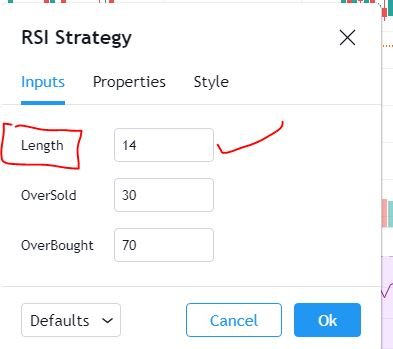
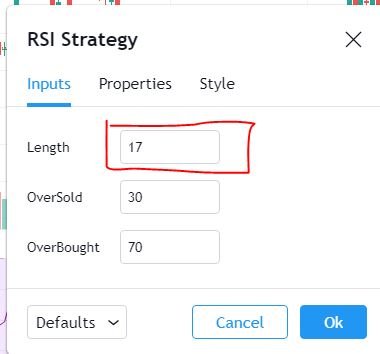
The Length the parameter
It is said to be as an amount in days it takes by the RSI indicator to analyzing its average value. In lunching the website, by default, the length parameter is mostly set to 14which aids it to have an effect on the graph. Shown below in the screenshot
Changing the length parameter
follow the same procedure as we did in the first part, buy selecting the fx tab and changing the length parameter.
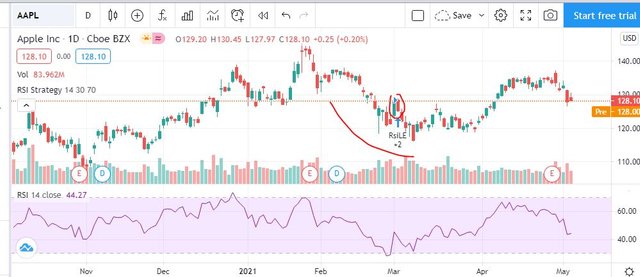
Question 4How do we interpret the overbought and oversold signals when trading cryptocurrency? (Screen capture required)
In trading RSI, we use the indicator showing between the range from 30%-70%. When the uptrend read up to 70% it means that RSI is overbought and when the downtrend read down to 30% it means it is oversold.
Question 5: How do we filter RSI signals to distinguish and recognize true signals from false signals. (screen capture require)
RSI signals can be distinguished to be when the RSI false signal trend does not reverse, this will simply alert you that there is a false signal but a case we see that there is a reverse, automatically we would know that it is a true signal.
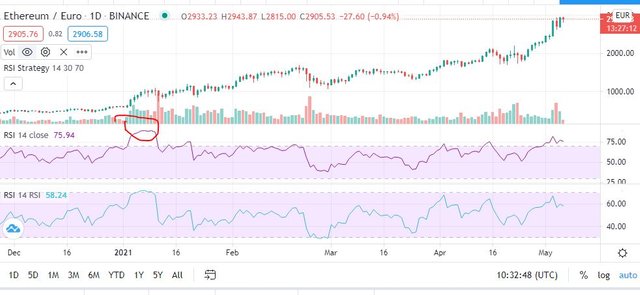
Question 6: Review the chart of any pair (eg TRX / USD) and present the various signals from the RSI. (Screen capture required)
A chart of Ethereum and Euro, in the chart we see that, Ethereum went pass the 70 mark level which means that Ethereum has been overbought as per standards but considering the Euro is still below the mark which makes it an oversold.
Conclusion
I will conclude by saying that RSI play an important role in trading. It is able to give out results where by you can analyze whether your trade could be valid or invalid, so far us this class is concern, I will say that professor @kouba01
did a great job
Thank you for reading
Hello @chinto1,
Thank you for participating in the 4th Week Crypto Course in its second season and for your efforts to complete the suggested tasks, you deserve a 4/10 rating, according to the following scale:
My review :
In this work, You tried to present most of the basics of the RSI in general without knowing how to use them to answer the questions asked.
Thanks again for your effort, and we look forward to reading your next work.
Sincerely,@kouba01