Steemit Crypto Academy Homework Post For @lenonmc21
Greetings to everyone on steemit, this is my assignment post for week on the topic "Analysis and Trading with the indicators "Stochastic Oscillator +" Parabolic Sar "".
What is the "Stochastic Oscillator" and what are all its components?
Stochastic oscillator is a common indicator that is used so many ways like it can be used as a momentum indicator and can also be used determine reversals that is, the relationship between overbought and oversold of assets in the market .
The indicator was initial developed in the 1950s by Dr. George Lane. The stochastic oscillator ranges from 0-100 which makes it an important indicator when determine the overbought and oversold condition of assets.
The main idea behind the stochastic oscillator is that, when the security price increases the closing price will fall to the highest over a given period of time, same as, when the security price decreases the closing will fall closer to the lowest low over a period of time.

Explain and define all components of the stochastic oscillator (% k line,% D line + overbought and oversold limits)
%k and %D lines
The two elements to this oscillator are the percentage k line which is the fastest and the slowest percentage D line which is the slowest.
Most components of the stochastic oscillation is measured using some mathematical formulas.
The formula for calculating the %K is:
%k = 100 * (C - L(N)) / (H(N) - L(N))
where:
C is recent price point
L is the least price point over a period of time
H is the highest price point over some period of time
N is a defined period. the values of N varies widely over a specified period of time.
The values of N can be 5, 10, 14, 21 and many more. normally 14 is the largely used period than the other periods.
With this formula we can calculate the %k of different points can be calculated for a period of time in a historic data. The set of data will be devided different, for example 14 can be months, days or weeks depending on the type data.
%D can also calculated as:
%D = (k1+k2+k3)/3
in this equation, %D is 3days moving average of %K values.
The %D line indicator, this indicator give accurate signals for a change in price over a period of time. Average values gotten from the calculated %D is plotted against the %k values.
Overbought and Oversold limits
In stochastic oscillation, current price range are compared in a given period of time. In the case of uptrends, stocks tends close to the highs and in a downtrend stocks move low from the trends.
Analyzing the overbought or oversold limits is very important in trading an overbought condition is when the trend towards 80 especially in long run successively higher prices and in an oversold condition, the trend moves below 20. however 20 and 80 can be change to 70 and 30, 75 and 25 but that will only depend on the volatility of instrument measured.
An oversold in the market is shown when the price of commodities is fallen sharply and expected to go higher. An overbought is shown in a market when the price of commodities has risen sharply and is expected for decline.
Briefly describe at least 2 ways to use the Stochastic Oscillator in a trade.
The two ways of stochastic trade is briefly explained below;
The stochastic oscillator is an indicator that is that is largely used in forex trading. mostly used to determine the potential trend reversal. Either the bearish or bullish trend of an asset is moved to a particular trend and so the movement of the stochastic trend line at a particular time shows traders the ongoing trend which is about to be retraced. if the market shows a strong trend the stochastic can be at the overbought and the oversold levels for a long period of time.
Secondly, the stochastic oscillator is used to determine the trade signals. It uses the K and the D line which give an additional signals to determine where the stochastic is going. if the K line crosses below the D line, the stochastic will be giving a downwards trend and also if the K line crosses above the D line, it shows that the stochastics is showing an upwards trend.
Define in your own words what is Parabolic Sar?
Parabolic SAR is an indicator used to predict the price trend of movement of assets or the change in price direction of assets. this indicator was developed by j. welles wilder Jr. the same creator of RSI{relative strength index}. it is mostly referred to as stop and reverse system SAR because, it easily determine the reversal price direction and the trend direction and also show clearly the exit and entry points.
The parabolic SAR indicator has a features of chats and dots in series the above or below trend on the price of assets depend on the direction of movement of the assets price.
On an upward trend a dot is placed below and when the dot is above it indicates a clear downward trend. It clearly explained that this is a unique indicator because it has more specific and distinctive features that other indicators like RSI and others do not have.
Explain in detail what the price must do for the Parabolic Sar to change from bullish to bearish direction and vice versa.
In the case of bullish or upward trend, a dot in the parabolic SAR is placed below the asset. price of assets in the bullish trend keep moving upward but the dot keep lying below the price. For the trend to change bullish to bearish direction, the parabolic SAR only need draw level with the price of assets downwards. In that sense the bullish trend will change to the bearish trend.
On the other hand, in the case of bearish or the downward trend, the dot in the parabolic SAR is placed above the asset. in this sense, price of assets in the bearish trend keep moving in a downward trend.
For it to change from bearish trend to the bullish trend, the price must only need to catch up with parabolic SAR upward before it will reverse its moving trend.
Briefly describe at least 2 ways to use Parabolic Sar in a trade?
There are many ways parabolic SAR can be used to trade. But I will briefly explain two of them below:
- Exit and Entry Point: one of the main way parabolic SAR can be used for trading is its ability to show a clear exit and entry point in trading. taking this scenario for instance, if an upward trend is at a point of reversing, the price will tend to the downward trend.
At this point, traders using the bullish trend will start to withdraw their assets and exit their order. more over, this will be the good time for traders to get ready for an entry of sell order.
- Trend Tracking another important point that can not be over looked when dealing with parabolic SAR is possibility to track trend of assets. It is use to assume the trend of assets over a particular period of time either bullish or bearish trend and also the direction of assets. On a bullish trend, the series of dots is placed below the trend and when the dots are above, it indicates a bearish trend.
Practice (Only Use your own images)
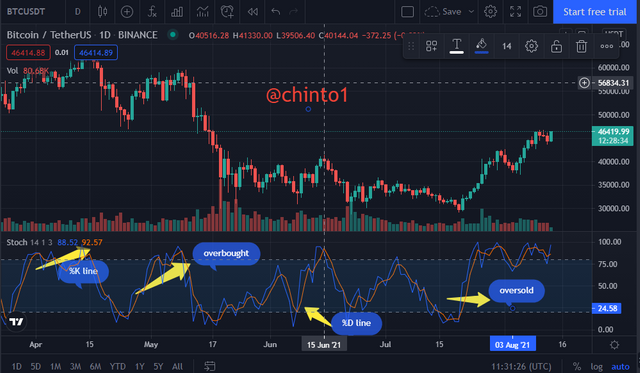
1. Show a step by step on how to add the Stochastic Oscillator to the chart ( Indicating the% k Line and the% D Line, the overbought and oversold zone )
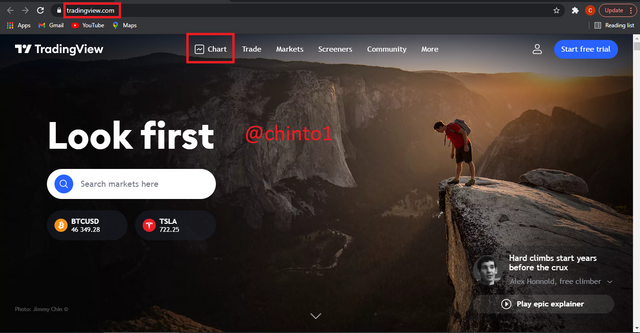
- Launch tradingview and click on chart.
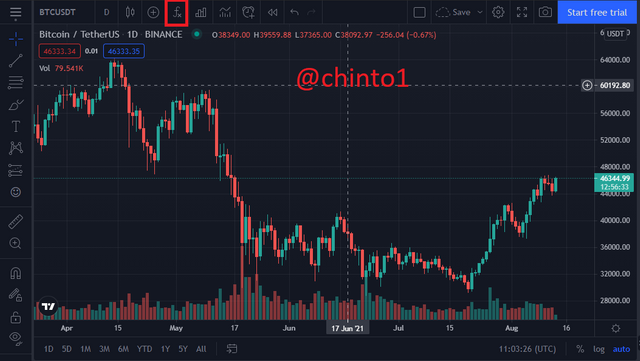
- Click on fx indicators at the top of the chart.
- Search Stochastic and click on Stochastic.

- The chart with stochastic oscillator is shown.
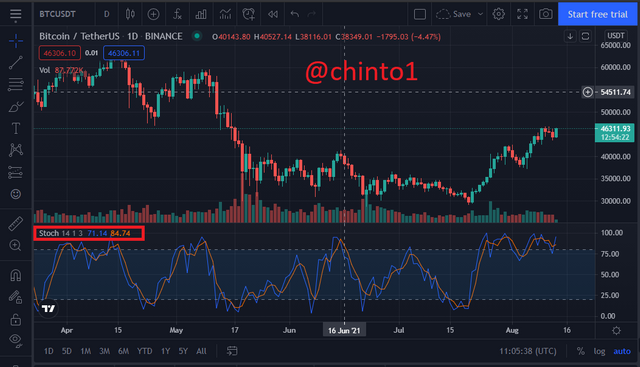
- The chart with %K and others are shown.
2. Show step by step how to add Parabolic Sar to the chart and how it looks in an uptrend and in a downtrend.
- Launch tradingview and select chart.
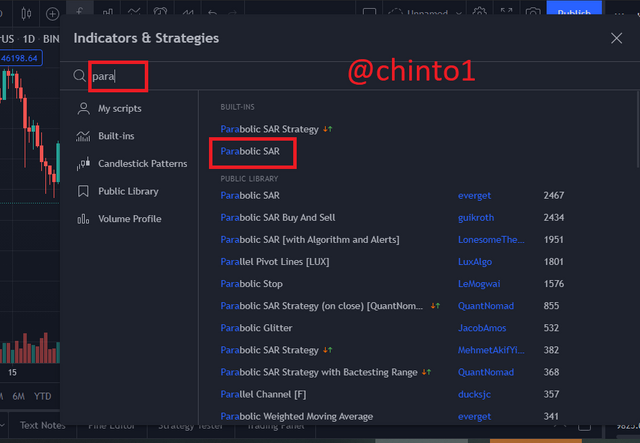
- Click on fx indicator.
- Search Parabolic and click on Parabolic SAR.
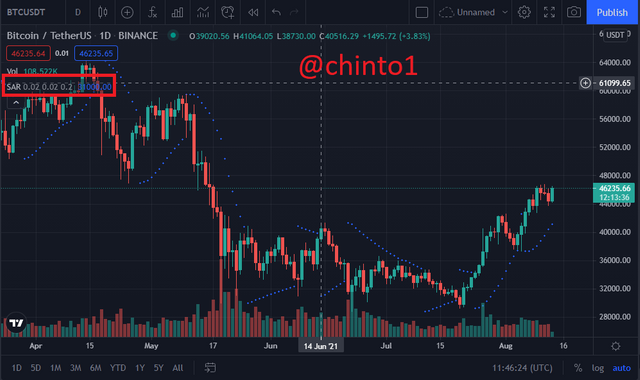
- The new chart is shown.
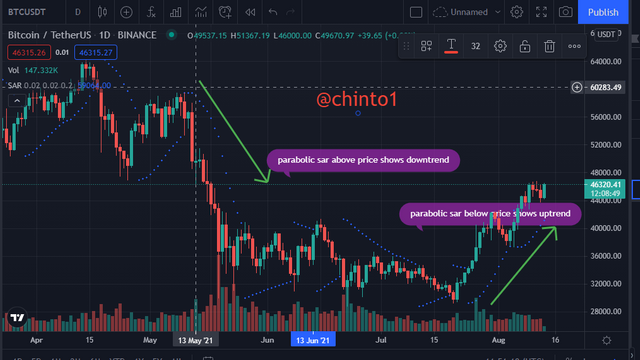
- The updated chart with uptrend and downtrend lines are shown.
3. Add Two Indicators ( Stochastic Oscillator+ Parabolic SAR ) And Simulate A Trade In The Same TradingView, On How A Trade Would Be Taken.
The parabolic sar and stochastic oscillator can be added together with the steps already shown above.
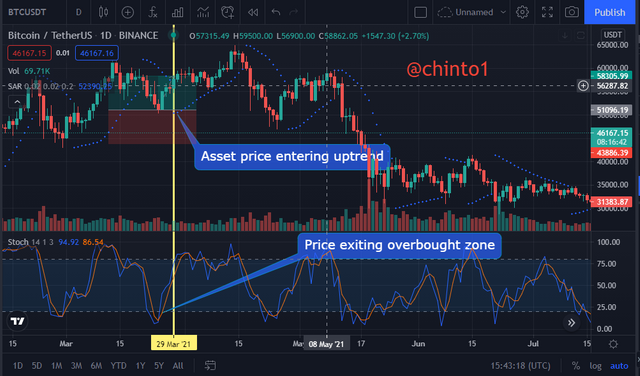
Buy Entry.
In the chart above, I have pointed out the point at which the parabolic sar is entering into an uptrend and when the stochastic sar is exiting oversold zone.
The indication of the PSAR that the trend is going upwards can mean a buy entry just like the indication of the stochastic oscillator leaving the oversold zone.
Stop loss set below the sar indication can be a very good to reducee loss.
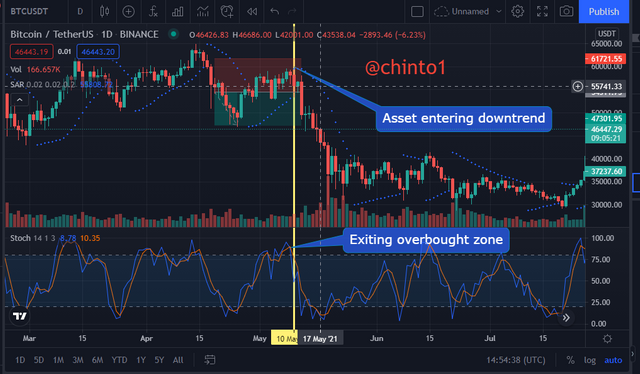
Sell entry
The sell entry is the reverse of the buy entry. This means that when SAR is entering into a downtrend and stochastic oscillator is leaving the overbought zone, it is a good time to sell.
Conclusion.
Thank you to professor @lenonmc21 for explaining how important and useful the parabolic sar and stochastic oscillator can be.
I have learnt how to add these 2 indicators to a chart to identify uptrend and downtrend lines, overbought and oversold zones to help reduce loss in trading.
Thank you.