Crypto Academy / Season 3 / Week 6 - Homework Post for [@cryptokraze]. Trading Liquidity Levels The Right Way Homework by @chinma

1. What is your understanding of the Liquidity Level. Give Examples (Clear Charts Needed)
Every dream of a trader is be a profitable trader, but most traders dreams are scattered due to improper information that has deluded them, their money gets finished due to excessive losses.
Today, we are not talking about any technical indicator, well most indicators actually lag, today we will be talking about a very important part of price action.
Today we shall be discussing about liquidity level. First of all, what is liquidity?
Liquidity simply means how good or active the crypto market is, or it can also be the amount of profit that is available to you, that can be converted to cash. Also we can say that liquidity is the availability of an asset, these can either be stock, currency, indexes, commodities or metals. Then levels are certain areas in the market, that you can find attractive.
So then what is liquidity level?
Liquidity levels are possible areas or region where an order can be placed, such orders includes the pending orders ( buy stop, sell stop, buy limit, stop limit, buy stop limit, sell stop limit, take profit, stop loss etc.) these areas has been envisioned by the traders that something good or bad might happen that areas. These areas are gotten by the help of a resistance or a support that is properly gotten.
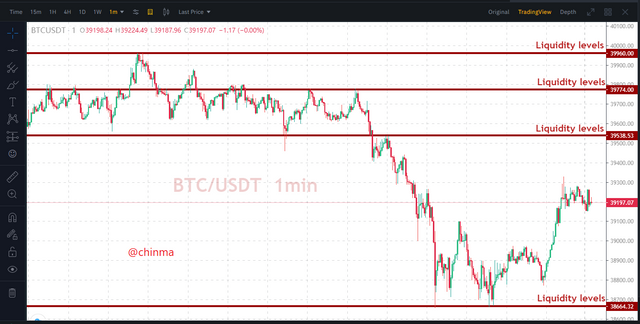
Picture from Binance.com
The above chart was between BTC/USDT in 1 minutes time frame. these are positions that buyer can put his/her pending order and it you notice very well, you will see inverted hammer and pinbar candlestick at the edge of the candlestick.

2. Explain the reasons why traders got trapped in Fake outs. Provide at least 2 charts showing clear fake out.
With liquidity levels properly understood, you'll see that liquidity level is very good for analysis.
Trapped traders are the traders that either entered the market wrongly and they are having huge losses that can also be cause by some emotional behaviour at that particular time.
We will be looking at what is called fake out and why are traders easily gets trapped in it, What is fakeout? fakeout simply means, when the price reaches the major support and resistance, sometimes it reversal to an opposite direction which most times will be against you. A fakeout can be also called a false signal, these are the following reasons why so many traders get trapped in fakeouts.
• The first reason why so many traders get trapped, is improper analysis. This is the major reason, because most traders do analysis and assume that they have gotten the analysis proper without checking in different time frame to check if their analysis is corresponding on the other time frames.
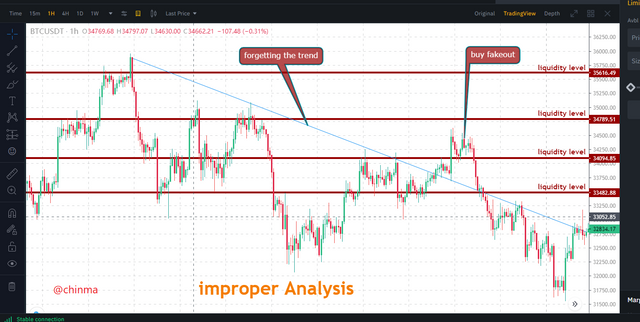
Picture from Binance.com
from the chart, BTC/USDT in 1 hour time frame, the trader forgot that there is a downtrend going on there. the trader was only just focused on the liquidity level on the horizontal support and resistance. improper analysis can make you trapped.
• Most traders find it very difficult to determine the major support and resistance in a market structure. they make the mistake to replace the minor support and resistance in place of the major one, this can be a cause a to be trapped in a fake out.
• Entering the trade so early, this has caused alot of traders to get trapped. they can't tell if the price will reverse. it is advise able to wait for a rebounce on either your support or resistance before entering the trade.
• It is not advise able to enter the market on your support or resistance level when the market is ranging or consolidating. it is advisable to always find a trending market and always wait for a rebounce before executing your trade.
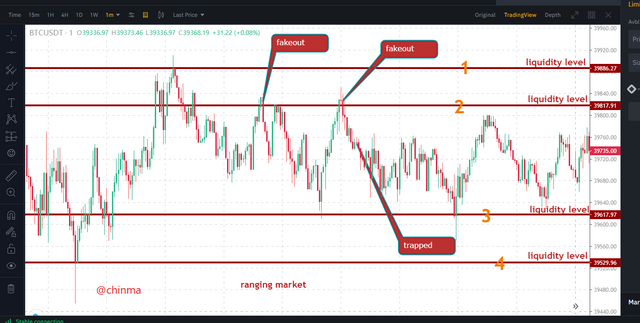
Picture from Binance.com
You can see from the BTC/USDT in the 1min timeframe, the market was seriously ranging. if the trader put a pending on the liquidity level 2 , he /she would have gotten trapped seriously. so it is advisable trade fake out in a ranging market.

3. How you can trade the Liquidity Levels the right way? Write the trade criteria for Liquidity Levels Trading (Clear Charts Needed)
In this question, we are looking at how you can trade the liquidity levels the right way. basically, there are two ways in which you can trade the liquidity levels properly, and they are the Market structure Break(MSB) strategy and the Break retest break (BRB) strategy. So we will have detailed understanding on how to trade the liquidity levels.
firstly, using the Market Structure Break(MSB) Strategy, the first thing you need to do, is to find the trend, because this will determine a lot of things as it helps to locate points of trend reversals.
You should know if the market has series of swings highs and lows in the uptrend market structure, in which the previous high will be lower and than the next high (in an uptrend) or vice versa (in a down trend) forming a zigzag like structure.
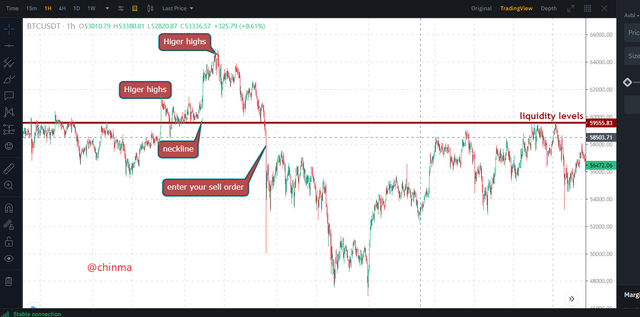
Now we look for a new lower high ( in an uptrend reversal) or a new higher low(in a downtrend reversal). We then mark the neck line and wait for price to break that line with an engulfing candle.
In liquidity levels using the market structure, your trade with the trend. using the MSB the trade entry for a buy should be:
• General market structure should be downward
• Mark lower lows and lower highs positions
• Wait for price to break structure forming a higher low.
• Mark neckline (as shown in chart below)
• Allow price to retrace reaching neckline.
• On price reaching and breaking neckline mostly with an engulfing candle stick, enter buy position setting stop loss and take profit.
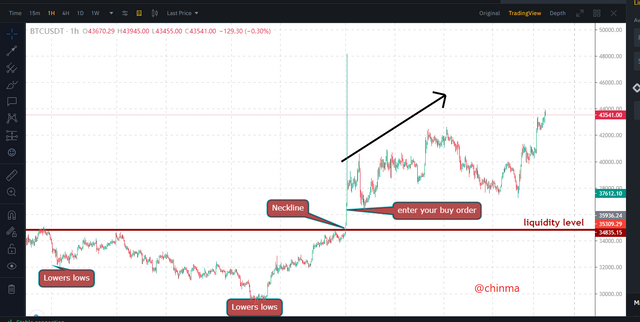
Picture from Binance.com
For a sell entry criteria.
• General market structure should be upward
• Mark higher highs and higher lows positions
• Wait for price to break structure forming a lower high
• Mark neckline
• Allow price to retrace reaching neckline.
• On price reaching and breaking neckline mostly with an engulfing candle stick, enter sell position setting stop loss and take profit.
Picture from Binance.com
Secondly, we will be looking at the next right way to trade a liquidity level which is the Break retest Break strategy. The break retest break strategy helps you to locate a point of trend continuation at important support and resistance. This strategy works simply like this, the price will move and then reverse a little ( the price normally breaks the support or resistance line by always retesting it.) before finally trends back up, breaking the initial swing point (either high or low depending on the trend).
For instance, when the price is approaching a resistance level during an uptrend, it normally create a swing high point that breaks the resistance level say momentum is strong enough. It then goes back to retest the resistance level and then turns back up to break its initial swing high point. This way traders can make use the Break retest break strategy to profit from the uptrend trend.
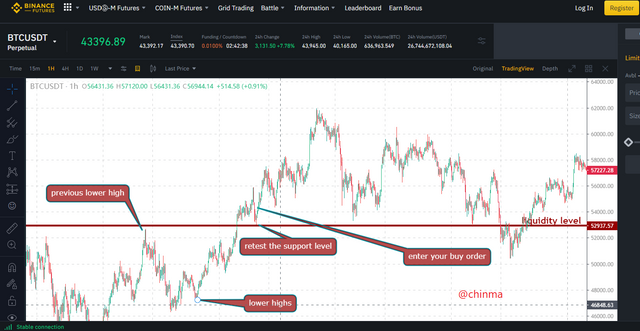
Picture from Binance.com
• General market structure should be upward
• Mark higher highs and higher lows positions
• Mark resistance line about to be broken
• After price breaks the resistance line, mark new highest high point of price.
• Allow price to retrace and retest resistance line
• On price trending back up, wait for it to break previous higher high level.
• Enter trade a little above here and set stop loss and take profit.
Examining the entry condition for a sell position
• General market structure should be downward
• Mark lower lows and lower highs positions
• Mark support line about to be broken
• After price breaks the support line, mark new lowest low point of price.
• Allow price to retrace and retest the support line
• On price trending back down, wait for it to break previous lowest low level.
• Enter trade a little below here and set stop loss and take profit.
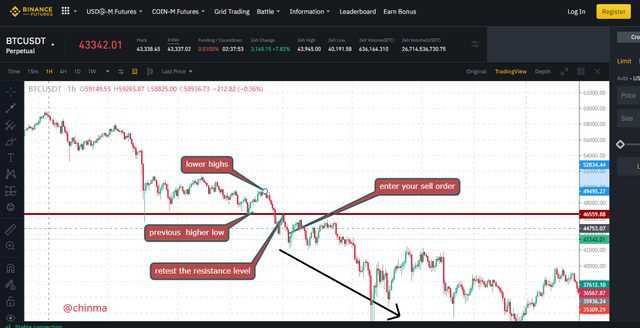
Picture from Binance.com

4 - Draw Liquidity levels trade setups on 4 Crypto Assets (Clear Charts Needed)
1, The first trade is the NKN/USDT in a 1 hour time frame. the liquidity levels were gotten after considering the previous highs and lows, so we can know the our entire region of the trade for the next day. in this chart, we sold, after placing our liquidity levels to determine the stop sell, take profit and stop loss. the style for this trade market structure break.
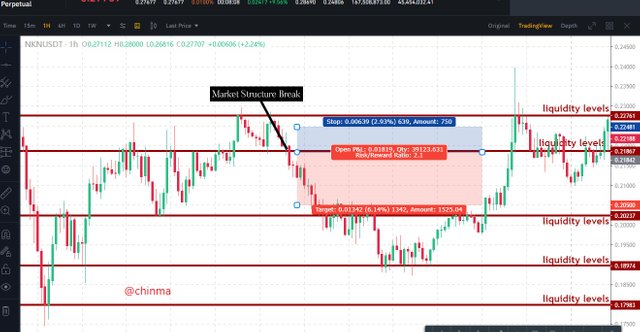
Picture from Binance.com
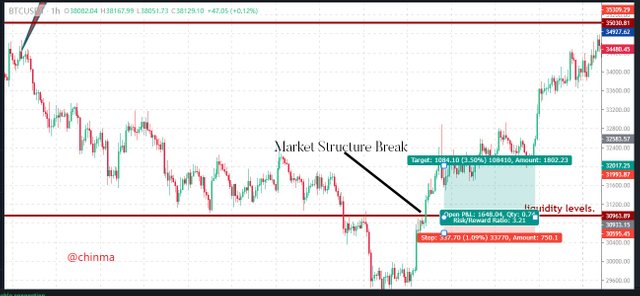
2, In the second chart, the chart is BTC/USDT in 1 hour time frame, the liquidity levels was located at a major support. the market structure break occurred on the liquidity level. our profit was achieved without stress.
Picture from Binance.com
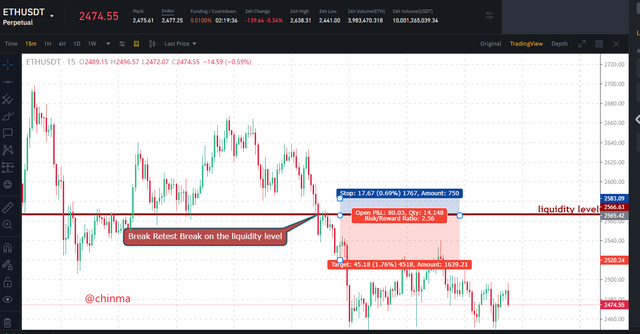
3, The 3rd chart is between ETH/USDT, in the 15mins time frame, while the pending order was placed, the price came to retest the liquidity level before finally selling.
Picture from Binance.com
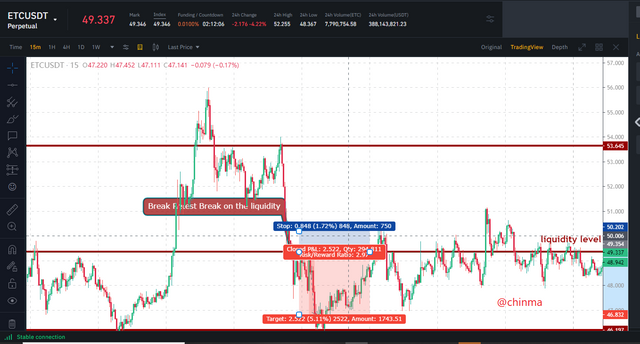
4, In the fourth trade, it is between the ETC/USDT in the 15 mins time frame, after locating the liquidity at a major resistance level. after placing the pending orders, the price still came to retest the resistance before finally falling down to hit our take profit.
Picture from Binance.com

Liquidity simply means how good and attractive the market is or it is the amount of profit available in the market. Liquidity levels are possible areas that a trader can be profitable, it involves the helps of support and resistance to properly determine those areas.
You can know the a liquidity area by the number of tops or bottom formed around that areas. And most traders sometimes can't adequately trade the liquidity market properly due to some factors such as improper analysis, inappropriate support/resistance level, no adequate strategy, and so on. so many traders have loss money but they are two adequate ways of trading with the Liquidity levels which are the market structure break strategy and the break retest break strategy.
The MSB is used to trade for reversal of trend or when a new trend is formed that is where we use the MSB while the BRB is for the continuation of trend. This usually break a support or resistance and retest it before breaking it finally.
Knowing how to trade with the liquidity level is profitable, it will help you if you properly analyse the market properly. Give it a try if you have not tried it before.
Thanks for reading.
@cryptokraze