Crypto Academy Season 03 - Week 08 | Homework post for [ @cryptokraze] |Advanced Course - Trading Sharkfin Pattern.
Homework: Trading Sharkfin Pattern.
Professor @cryptokraze
Written by @chinma
Image from source
1 - What is your understanding of Sharkfin Patterns. Give Examples (Clear Charts Needed)
Patterns are repeated regular price movement that has occurred over time in the market. Identification of patterns as a trader is a very great skill.
Today, we will be looking at a very important trading pattern- which is called the trading sharkfin pattern. The Sharkfin patterns are formed at a high volatile market when the price moves quickly and then make a sudden reversal, this happens because the price is either on the high point of the market or the low point of the market. Most of the time, the formation of the V shape pattern happens as a result of the price reversal when the market is on a downtrend but an inverted V shape pattern is formed when the market is on an uptrend.
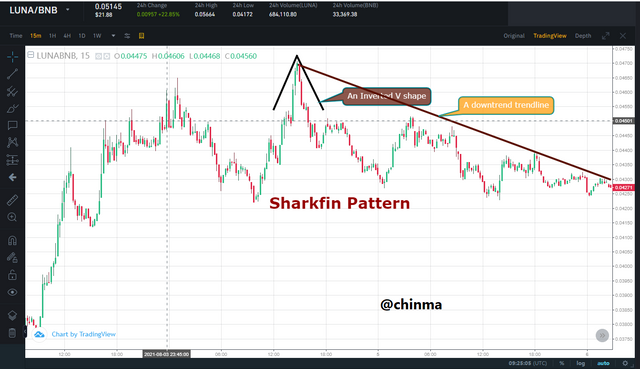
LUNA/BNB M15 chart from Binance
This is an example of a Sharkfin pattern, in of chart of Luna/BNB in a 15 mins time frame, indicating a downtrend and we can see that the it formed an inverted V shape at a very high point of the market. it is a good opportunity for the sellers to dominate the market.
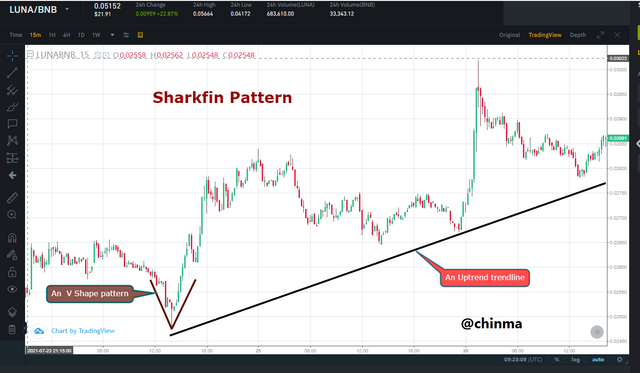
LUNA/BNB H1 chart from Binance
This is an example of a sharkfin pattern, in the of a LUNA/BNB, in a 15 mins time frame, showing an uptrend directional movement of the price with a V shaped pattern, indicating a buy order.
2 - Implement RSI indicator to spot sharkfin patterns. (Clear Charts Needed)
Sharkfin pattern most times can be spoetted wrongly, and traders can lose a lot of money, and this is why traders had to look for a solution in order to assist them spot the proper sharkin pattren. So the Relative Strength Index indicator was adopted in reading the Sharkfin patter easily. The first thing you need to do in using the RSI for reading the Sharkfin is to it to its defaut period of 14, and its bands should also be the 30 and 70.
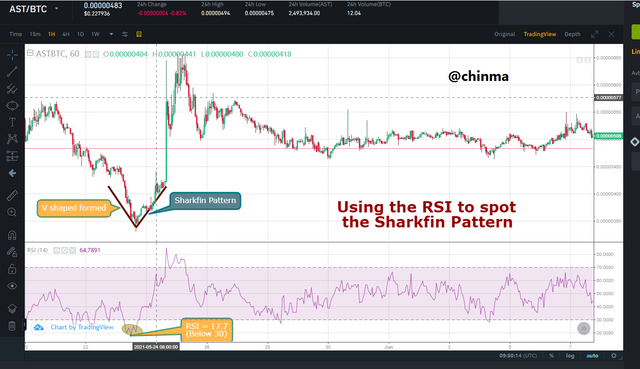
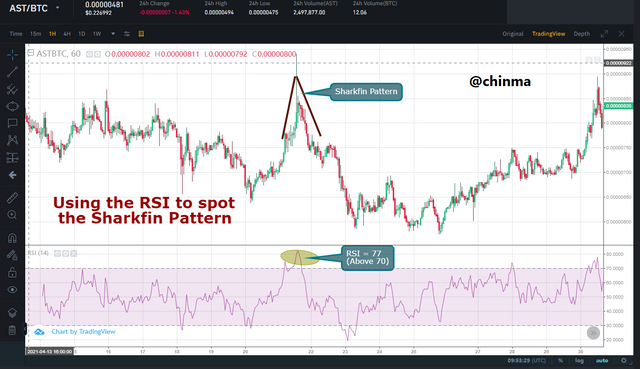
AST/BTC M15 chart from Binance
To use the RSI to a reversal for a buy option in the sharkfin pattern, The RSI must go below the 30 level, once you noticed that the RSI is below the 30 level, watch if the price has also made a quick reversals with long candlesticks, if yes, you can confirm that this is a sharkfin pattern.
AST/BTC H1 chart from Binance
To use the RSI to a reversal for a sell option in the sharkfin pattern, The RSI must go above the 70 level, once you noticed that the RSI is above the 70 level, watch if the price has also made a quick reversals with long candlesticks, if yes, you can confirm that this is a sharkfin pattern.
3 - Write the trade entry and exit criteria to trade sharkfin pattern (Clear Charts Needed)
Now let's look at the criterias for the entry position for buy order
- Open your trade using tradingview or any other platform of your choice
- Add the RSI indicator, leave all the settings at its default settings
- Allow the RSI to go below the 30 level
- Also allow the fast moving price to make a quick reversal with longsticks.
- Check if the V shape is formed
- You can now place your buy order
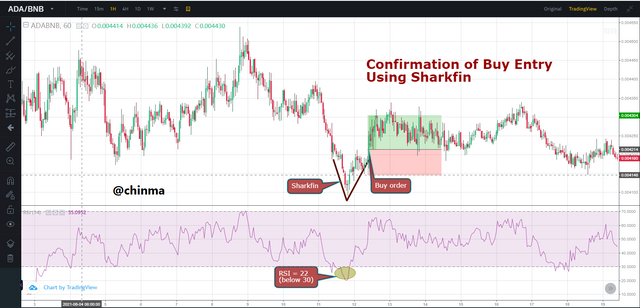
ADA/BNB H1 chart from Binance
You can see for yourself, the pair of ADA/BNB in 1 hour time frame, with the set up for a buy entry.
Now let's look at the criterias for the entry position for Sell order
- Open your trade using tradingview or any other platform of your choice
- Add the RSI indicator, leave all the settings at its default settings
- Allow the RSI to go above the 70 level
- Also allow the fast moving price to make a quick reversal with longsticks.
- Check if the inverted V shape is formed
- You can now place your Sell order
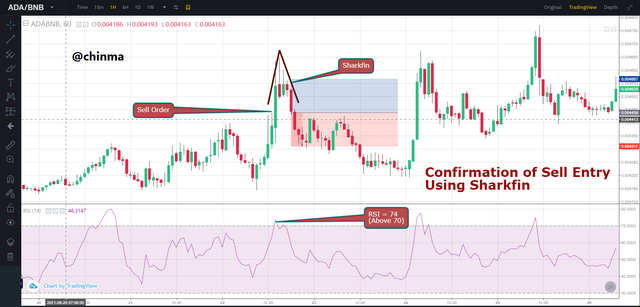
ADA/BNB H1 chart from Binance
Now let's look at the criterias for the Exit position for Buy order
- You must set you stop loss to avoid unnecessary, had i know
- The swing low piont of the SHarkfin pattern should be you stop loss
- Or you can wait after you have executed the trade, if the trade is going against you, you can manually exit the trade.
- Make sure to also set your take profit level so if the price goes in your favour, it might help you exit it
- For a start, you can use 1:1 risk to reward ratio as a starter, but as you master the pattern, you can increase the profit.
- You can manually take your profit if you are satisfied or noticed as reversal of the trend before it reaches your take profit or allow it to hit your take profit.
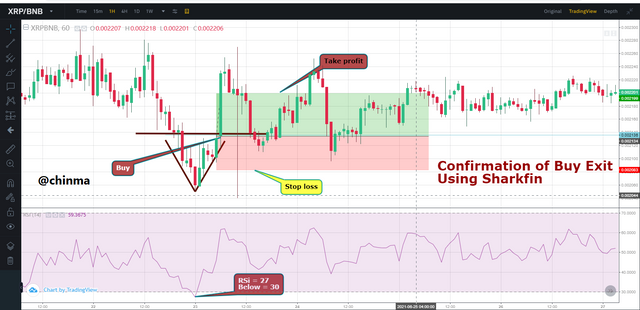
XRP/BNB H1 chart from Binance
This is a pair of XRP/BNB on a 1 hour time frame, showing you how to exit buy order.
Now let's look at the criterias for the Exit position for Sell order
- You must set you stop loss to avoid unnecessary, had i know
- The swing high piont of the Sharkfin pattern should be you stop loss
- Or you can wait after you have executed the trade, if the trade is going against you, you can manually exit the trade.
- Make sure to also set your take profit level so if the price goes in your favour, it might help you exit it
- For a start, you can use 1:1 risk to reward ratio as a starter, but as you master the pattern, you can increase the profit.
- You can manually take your profit if you are satisfied or noticed as reversal of the trend before it reaches your take profit or allow it to hit your take profit.
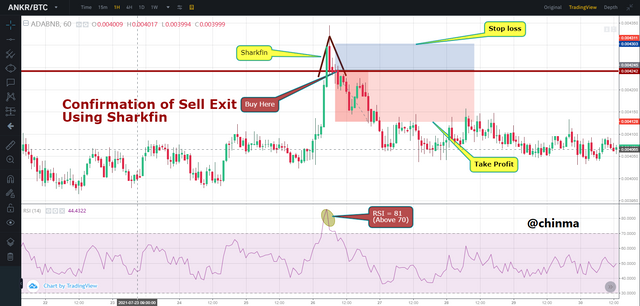
ANKR/BNB H1 chart from Binance
This is a ANKR/BTC pair on a 1 hour time frame, showing you how to exit a sell order
4 - Place at least 2 trades based on sharkfin pattern strategy (Need to actually place trades along with Clear Charts)
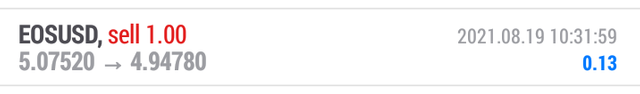
This is a trade of the EOS/USD using Demo account. This trade was placed using the sharkfin pattern strategy in a Daily Time frame. We can see that the reversal had already formed and it produced an Inverted V shaped pattern and the RSI was Above 70. At this point, it is a very good opportunity to sell and we have sold.
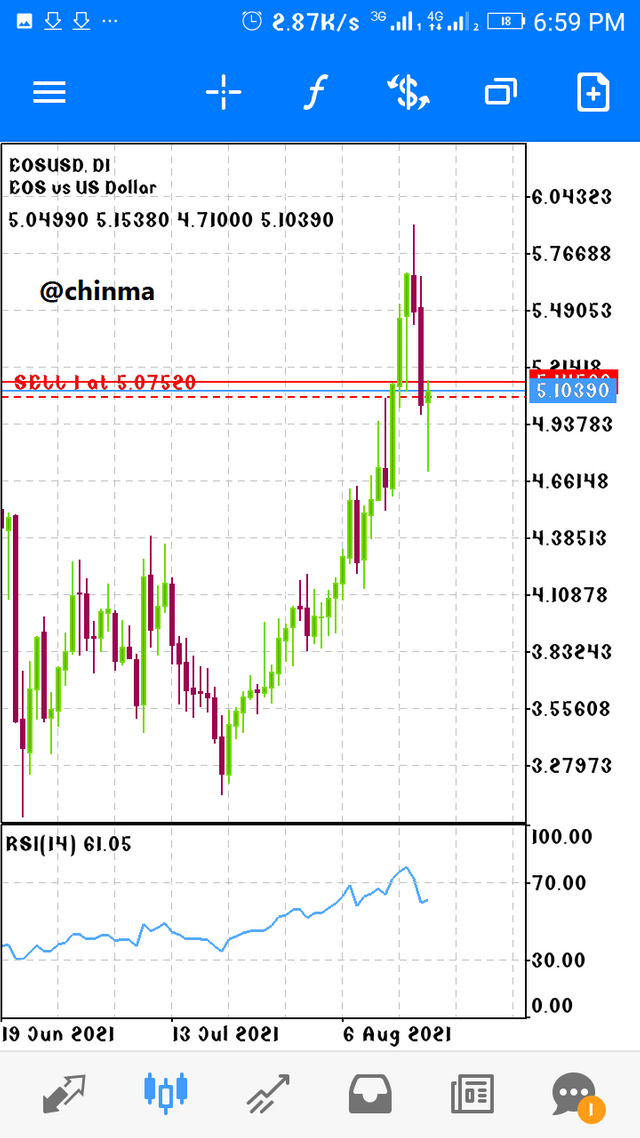
EOS/USD chart from MT5
Screenshots from MT5 app
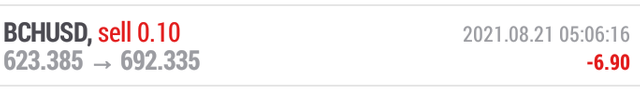
This is a pair of BCH/USD in a 1min timeframe,using the sharkfin pattern trading strategy. we can see that it has formed a V shaped pattern at the down of the trade, indicating a buy which is accompanied by the RSI which was below 30. The reversal had formed finished, so i bought.
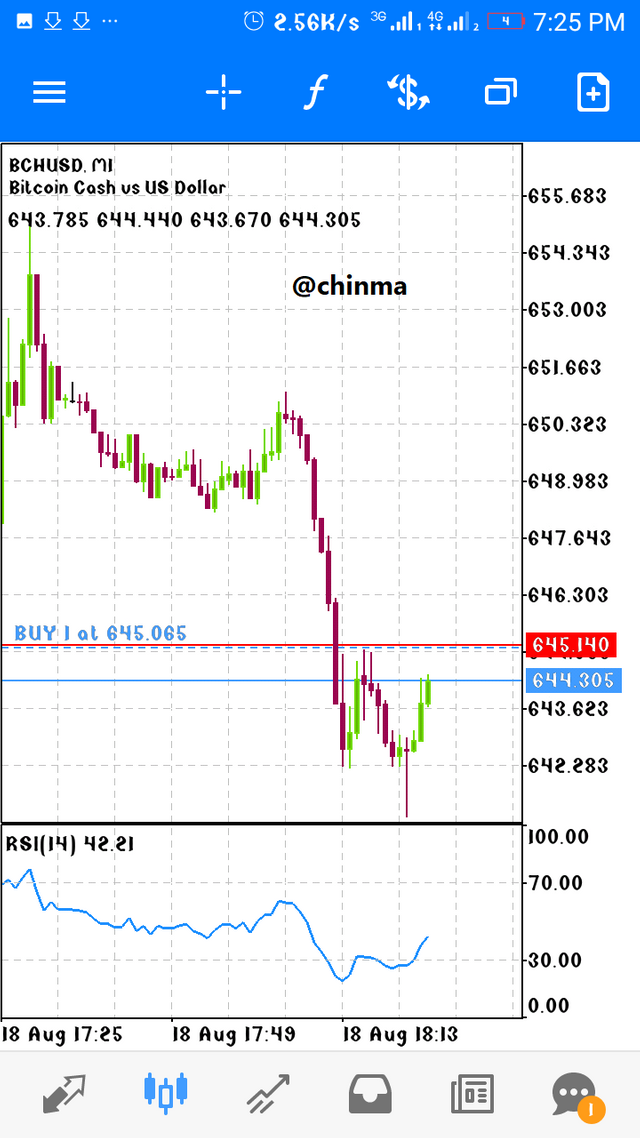
BCH/USD chart from MT5
Screenshots from MT5 app
Concluding, Sharkfin Pattern are used to trade quick reversal, most times with the help RSI it works better and the V shaped or the inverted V shaped must be formed too. To use it to buy, the RSI must be below 30 and to use it to sell the RSI must be above the 70 level. Ensure to apply proper risk management adequately.
Thanks to professor @cryprokraze for the wonderful lecture.