Steemit Crypto Academy – Season 3 - Week 7 - Post for @yousafharoonkhan

Question 1 - Defining the TradingView site and how to register an account in tradingview? what are the different registration plan
When it comes to cryptocurrency trading, technical analysis has proven to be very vital, there are a lot of tools that play a very important role in technical analysis and are also very beneficial in helping traders make the best trading decisions. Tradingview is basically a charting platform with great and amazing tools mostly used for technical analysis. It is used to track prices of different supported assets like various cryptocurrency assets with tools that allow traders to forecast future prices of any cryptocurrency asset.
Main features of tradingview
- Responsive user interface
- Smart drawing tools
- Customizable interface
- Wide variety of cryptocurrency assets
- Multi-timeframe analysis
- Paper trading
- Quality charting tools
- Text notes
- Quality technical indicators
- Auto save feature
- Snapshot tool
- Receive alerts
- News
- Watchlist
- Chats
- And more…
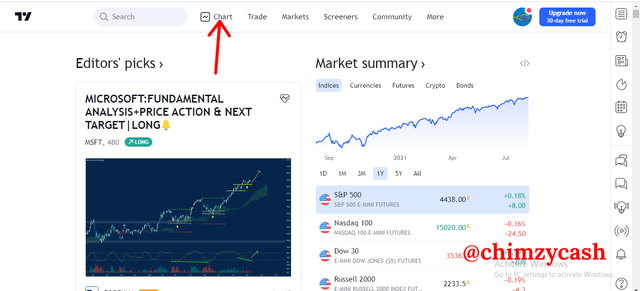
On the tradingview front page, the navigation bar contains the different sections, useful links and features of the tradingview platform. The different links on the navigation bar are; Chart, Trade, Markets, Screeners, Community and More.
Chart - The chart section is the main charting platform that contains a variety of high quality technical analysis and smart drawing tools for technical and fundamental analysis.
Trade - The trade section contains the various top brokers that are on tradingview. Some of the top brokers are Capital.com, currency.com, FXCM, Chaka.
Market - The market section contains all the different assets and products available on tradingview. The available assets on tradingview are cryptocurrencies, currencies, indicies, stocks, futures, bonds, sparks.
Screeners - This section screens and evaluates all the available assets on tradingview. The available screeners are crypto screeners, stocks screeners and forex screeners. Each screener section contains all the available assets for each section.
Communities - This sections contains the authors and different contributors to tradingview.
More - This section contains the pricing, features, help center, downloaded application, about section.
How to register an account in tradingview
Registering an account on tradingview is a straightforward process. To do this, visit the tradingview website at https://www.tradingview.com
- On the homepage, click on start free trial. Tradingview offers free trial on their different plans, however, we will be creating a free account.
.png)
- You can select any of the different plans and click on try free for 30 days. However, to create a free account, navigate down and locate try free basic
.png)
- Choose your preferred signup method, I will be choosing email method.
.png)
- Input your email and strong password, accept the terms, verify the captcha and click on create account.
.png)
- An email will be sent to verify your email address, verify the email to complete the signup process.
.png)
What are the different registration plan?
Tradingview has different registration plans for users to choose from. At the moment, there are 3 registration plans which can be monthly or annually. The different registration plans currently are; pro plan, pro+ plan and premium plan.
Free Basic plan
The free plan is very common as it allows anyone to make use of the tradingview platform without worrying about cost. This is great for beginners who want to learn and understand how tradingview works and how to make use of some of its features, before making the decision to pay for the paid plans. However, the free plan doesn’t give access to all the features. The free plan are limited to a number of features which means that some features are only for the paid plans. Nonetheless, the free plan is good enough for many types of users and has a lot of powerful and useful features and tools to perform high quality technical analysis on the different assets.
.png)
Pro plan
The pro plan is the least plan on tradingview and cost $14.95 per month or $155 per year. Some of the key benefits of the Pro plan;
- 5 indicators per chart,
- 2 charts in one window,
- 20 server-side alerts,
- Ad-free,
- Volume profile indicators,
- Custom time intervals,
- Multiple enhanced watchlist,
- Bar replay on intraday bars.
Pro+ plan
The pro+ plan is the middle plan and cost $29.95 per month or $299 per year. Some of the key benefits of the Pro+ plan;
- All the benefits of the Pro plan;
- 10 indicators per chart,
- 4 charts in one window,
- 100 server-side alerts,
- Intraday exotic charts,
- Charts based on custom formulas,
- Chart data export,
- Indicators on indicators.
Premium plan
The premium plan is the third and most expensive plan on tradingview and cost $59.95 per month or $599 per year. This plan is the complete package. Some of the key benefits of the premium plan;
- The complete package,
- 25 indicators per chart,
- 8 charts in one window,
- 400 server-side alerts,
- 5 devices at the same time,
- Second-based intervals,
- Alerts that don't expire,
- 4x more data on charts (20K bars),
- Publishing invite-only indicators.
.png)
.png)
Question 2 - Explain the different features of tradingView and what is your favorite feature and why?
The tradingview platform is packed with a variety of amazing features. Some of the main features of tradingview are;
Chart
Chart is one of the main features of the tradingview platform. The tradingview chart interface is intuitive and yet powerful, allowing users to perform proper technical and fundamental analysis on different cryptocurrency asset. On the chart interface, users can analyze prices of different assets, determine market patterns, draw on the charts, forecast future prices using powerful technical indicators and more.
.png)
Market
The market feature contains all the available markets on tradingview. For crypto users, tradingview has a variety of different markets for cryptocurrency pairs, allowing crypto users to perform high quality technical analysis and fundamental analysis on the different cryptocurrency markets.
.png)
Watchlist
The watchlist is another important feature on tradingview. On tradingview, watchlist allows users to create a list of different assets for the purpose of monitoring the selected assets. The watchlist features shows the main stats of the selected assets such as price, percentage change, volume, average volume, performance, technicals.
.png)
Alerts
The alert is also another very good feature on tradingview. The alert feature is for notifications. When alerts are set, the alerts are triggered and notifications sent when the specific conditions are met.
.png)
Public Chats
The public chat is a very good feature on tradingview that allows users to communicate with other users on tradingview right inside the tradingview interface. Like a group chat, users can interact with other members of the community. The benefit of this feature is that users can ask questions and get instant response from other users in the community.
.png)
Smart drawing tools
Tradingview is packed with a variety of quality tools for smart drawing on charts. When charting on tradingview, tools can be used for better technical analysis and charting.
.png)
Indicators and strategies
On tradingview, there are a lot of indicators and strategies that can be added to the chart for signals and for better technical analysis. Some of the main types of indicators on tradingview are oscillators, scripts and more.
.png)
My favorite feature
My favorite on tradingview is the chart feature because in my opinion, it is one of the most important elements of tradingview and one of the main reasons why I make use of tradingview. Even though there are a lot of amazing features on tradingview that have their own benefits, the chart feature is for me the standout feature. One of the reasons why I like the chart feature on tradingview is because it is intuitive and yet very powerful for any type of technical analysis. I make use of the chart feature a lot when performing technical analysis on any cryptocurrency asset and with the help of other features such as the smart drawing tools and indicators, I am able to perform quality technical analysis for trading.
Question 3 - How to set up a chart in TradingView and use two tools to edit it
Setting up a chart on tradingview platform is an easy process. To do this,
- After signing up on tradingview, on the navigation bar, click on the Chart.
.png)
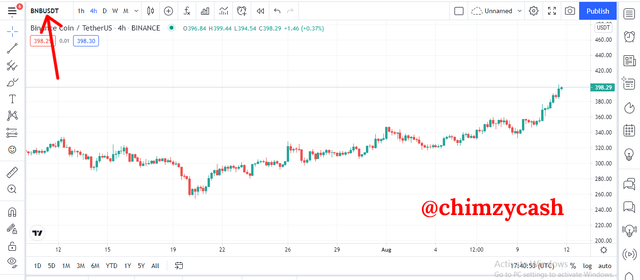
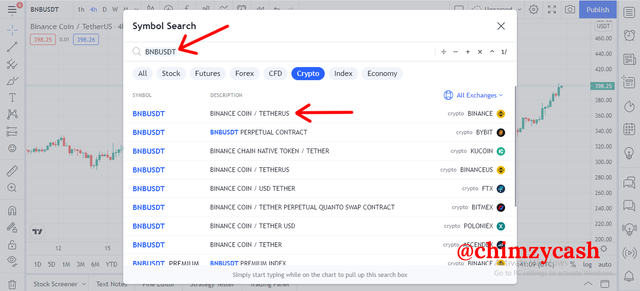
- To change the asset pair, click on the asset pair at the left and search for the asset pair of your choice. This will be the pair that will be analyzed on the chart.
.png)
.png)
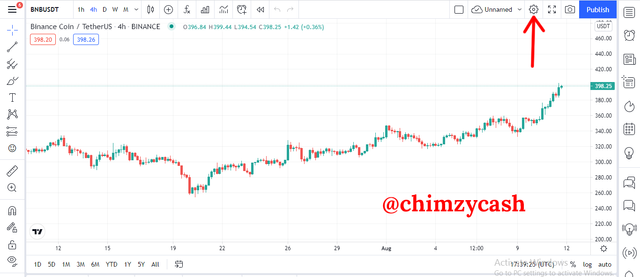
On the chart interface, you can set up the chart interface to fit your needs. The default settings work well but tradingview allows users to make changes to the chart.
To access the chart settings, click on the gear icon. The chart settings has different parameters that can be changed. The main sections on the chart settings are; symbol, status line, scales, appearance, trading
.png)
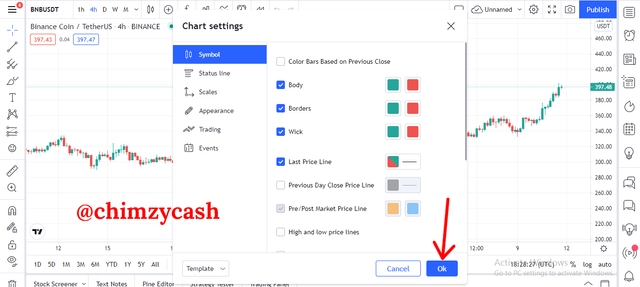
- The Symbol setting allows users to make colour changes to the candlesticks and price lines on the chart. Also, users can turn on and off the different elements of candlesticks. Default setting works well.
.png)
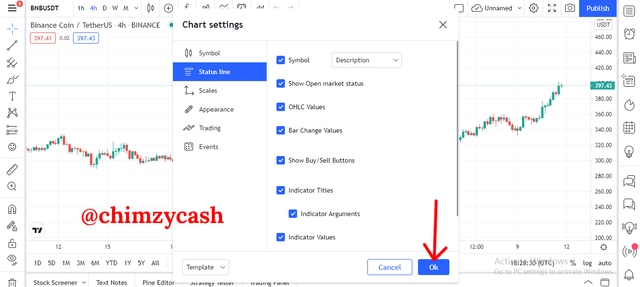
- The status setting allows users to make turn on and off the different status line elements on the chart interface. Default setting work well.
.png)
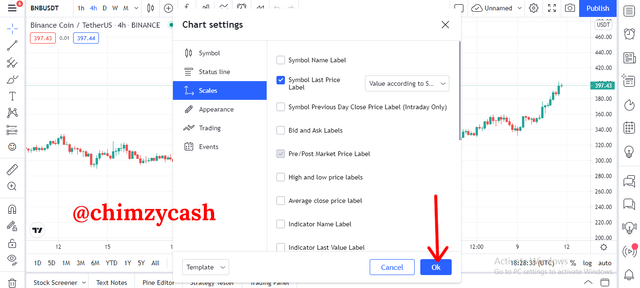
- The scales setting allows users to turn on and off the different labels and make changes to the scales. Default setting works well.
.png)
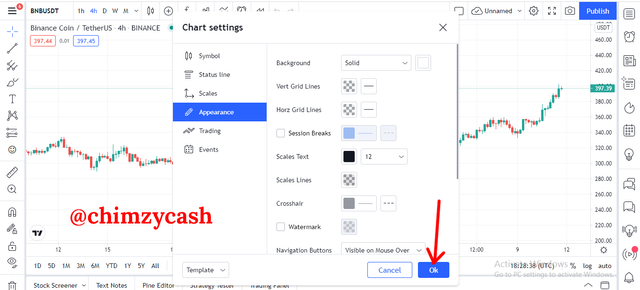
- The appearance setting allows users make visual changes to the chart interface. Colours, text, scale lines, crosshair, watermark can be changed in the appearance setting.
.png)
- The trading setting allows users to make changes and turn on and off the different elements for trading on tradingview. Elements such as buy and sell button, bid and ask, positions etc can be adjusted.
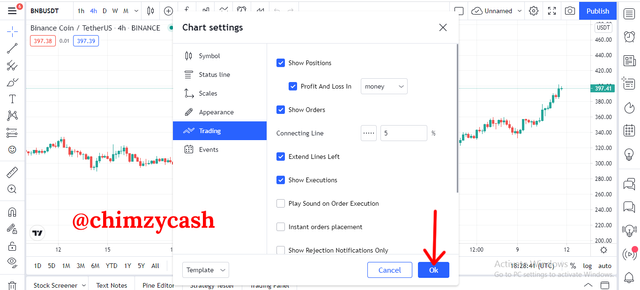.png)
- The event setting allows users to turn on and off the different events elements such as dividends, earnings on chart etc.
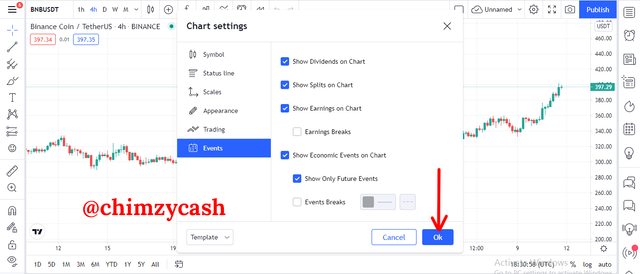.png)
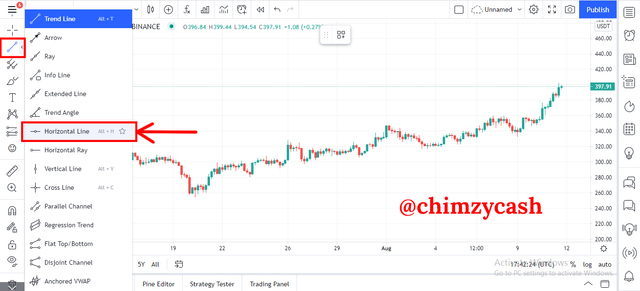
The horizontal line tool
The horizontal tool is a smart drawing tool that is basically used to mark specific price points on the chart. This is a great tool that can be used to mark support and resistance price points.
To use the horizontal line tool to edit the chart when performing technical analysis, double-click the second tool on the tool menu and select the horizontal line tool from the options.
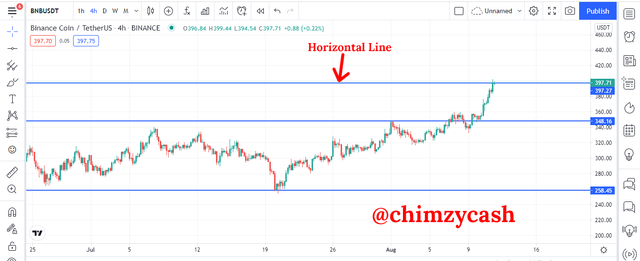
After selecting the horizontal line tool, click on any price point on the candlestick chart to place the horizontal line. You can place as many horizontal lines as possible to mark different price points.
.png)
.png)
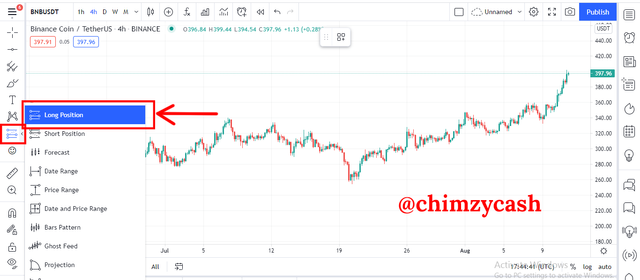
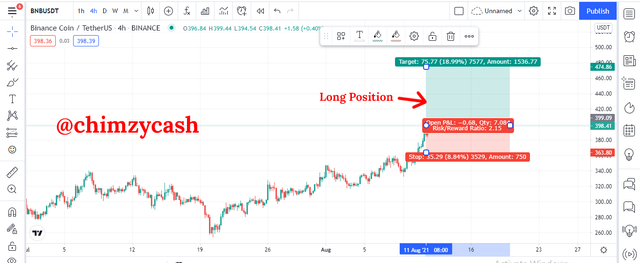
The Long position tool
The long position tool is another smart drawing tool that is basically used to set a long position for entry point, exit point and stoploss. This tool is used to visually mark the predicted long position on the chart, determining the number of pips and risk:reward ratio.
To use the long position tool to edit the chart when performing technical analysis, double-click the seventh tool on the tool menu and select the long position tool from the options.
After selecting the long position tool, click on the entry point on the candlestick on the chart to place the long position. The long position tool can be scaled to set the different positions for entry, exit and stoploss.
.png)
.png)
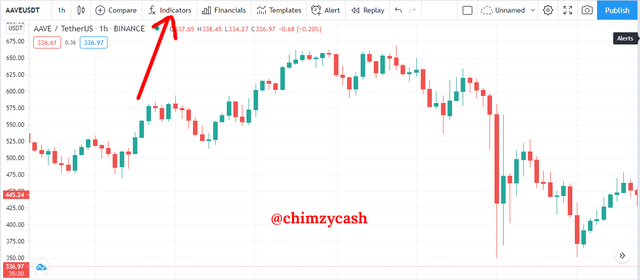
Question 4 - Explain how to add indicator in chart, what is your favorite indicator and why?
For this demonstration, I will be showing how to add the MACD indicator on a chart.
To add the MACD indicator on any cryptocurrency price chart, click on the indicators tab located at the top
.png)
- The search window will pop up, click on the search input and type MACD
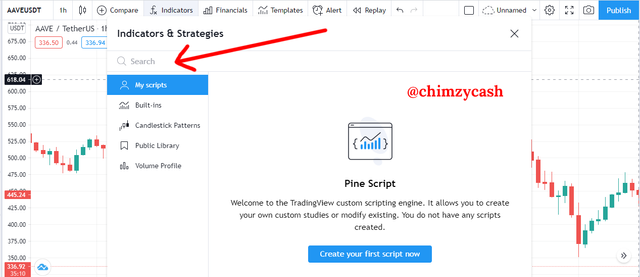.png)
- All the indicators that is related to MACD will be displayed, choose the first indicator with only MACD
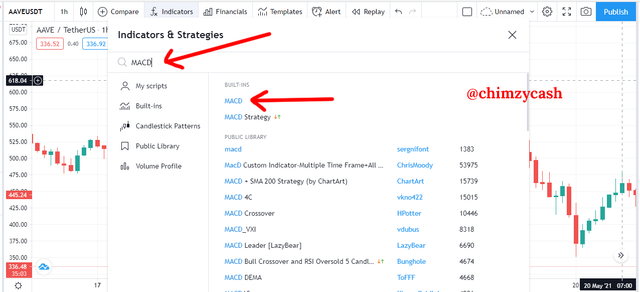.png)
- To access the MACD indicator settings, click anywhere on the MACD pane and click on the settings gear icon
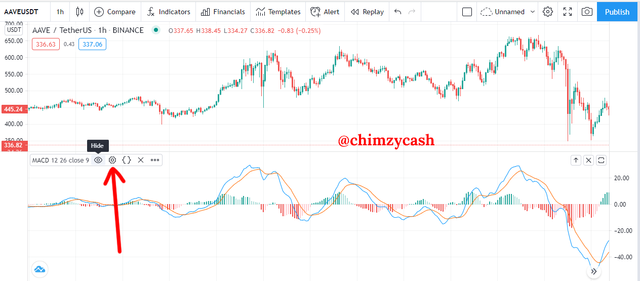.png)
The MACD settings allows you to make changes to the inputs and styles based on your needs.
The input sections allows you to change the fast length, slow length, source and signal smoothing parameters to fit your analysis needs.
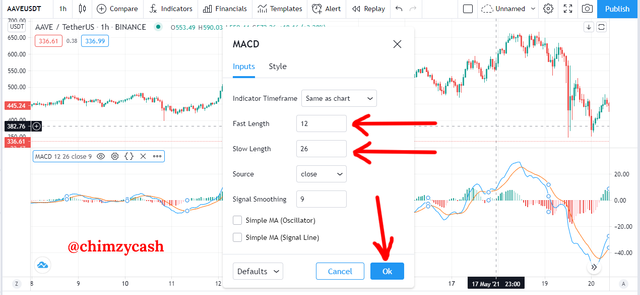.png)
- The styles section allows you to change the visual look of the MACD elements such as the colours and thickness of the lines.
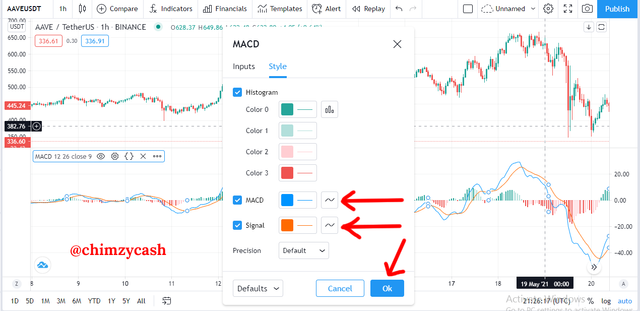.png)
.png)
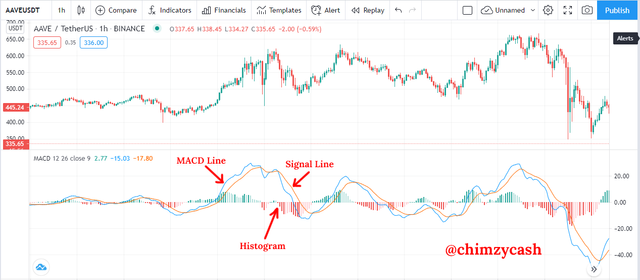
My favorite indicator is the MACD indicator - The MACD (Moving Average Convergence Divergence) indicator is a very powerful and yet easy to use indicator that is used to identify momentum of price of any cryptocurrency asset in the market. It is a trend-following momentum indicator and for me, it is a very useful indicator that can help determine market trends, entry and exit points based on the momentum of the price movements. To use the MACD to identify entry points, when the MACD line comes from below and crosses above the signal line. Also, to use the MACD to identify exit points, when the MACD line crosses comes from above and crosses below the signal line.
Question 5 - Do you think TradingView is useful in predicting the market for cryptocurrency (trend / price)?
In my opinion, tradingview is very useful for technical analysis and predicting the trend or price of any cryptocurrency asset. Tools and indicators can be applied on the chart interface of tradingview to predict future prices and trend of any cryptocurrency asset. Tools such as line tool is a great way to marking out the support areas so as to have a clear view of where the market is going. When it comes to predicting market trends and prices of cryptocurrency asset using tradingview, indicators are very beneficial.
Indicators such as moving average and MACD are very good example of powerful indicators that can help predict the direction of the market. For instance, on the AAVE/USDT chart, when the price is above the moving average, it can be a great indication that the market is in an uptrend. Also, the MACD can also be used alongside with the moving average to identify the trend direction. When the MACD is above the zero level, it can be a strong uptrend signal. On the chart, we can see that the MACD is above the zero level.
.png)
6 - Conclusion
Tradingview has proven to be a very valuable and beneficial platform for traders and technical analysis when it comes to making the best trading decisions. Tradingview as a platform is basically a charting platform with great and amazing tools mostly used for technical analysis. It is used to track prices of different supported assets like various cryptocurrency assets with tools that allow traders to forecast future prices of any cryptocurrency asset. Packed with a lot of quality tools and indicators, when used correctly, traders can make use of the tradingview to predict the market, identify the best entry and exit points so as to make the most profit.
Respected first thank you very much for taking interest in SteemitCryptoAcademy
Season 3 | intermediate course class week 7
your work is good, and your homework is looking very good , and thank you very much for taking interest in this class