Steemit Crypto Academy – Season 3 - Week 5 - Post for @imagen
Question 1 – Make an Investment on any of the cryptocurrencies
You can make your investment in another cryptocurrency, but you have to answer the same questions. (Currencies that are not allowed: TRON, Steem, SBD, Bitcoin, Ethereum or any stablecoin)
Polygon - MATIC
Polygon is one of my favorite cryptocurrency because of its potential to the upside. After my research and fundamental analysis, I have decided to make an investment on this project. I will be making a purchase of MATIC on the Okex exchange using the USDT pair.
In order to purchase MATIC on the Okex exchange, I will first of all deposit some funds into my Okex account. I will be depositing USDT as it is the currency pair I want to purchase MATIC on.
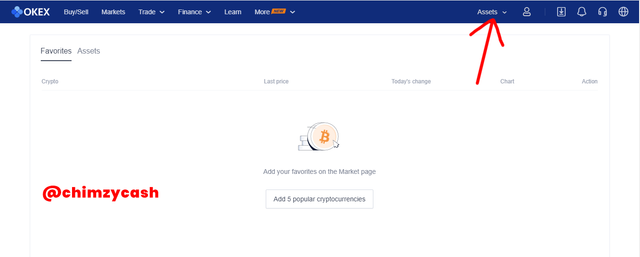
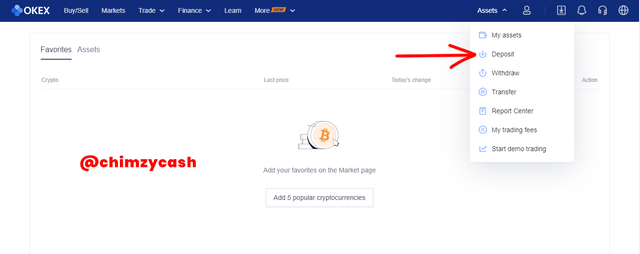
On the Okex account, go to assets and select deposit from the options.
.png)
.png)
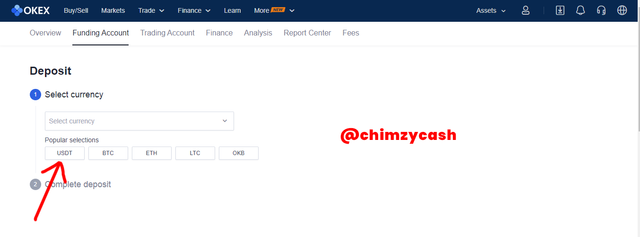
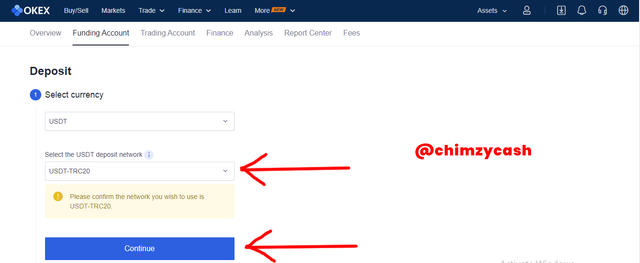
For this step, any currency can be deposited, however, my preferred currency pair is USDT. I will choose the USDT option and select the USDT on blockchain. USDT on tron is my choice because of the fast transaction and low fees.
.png)
After that, Click on continue to proceed. The next page will be to copy your USDT Tron address to deposit the funds.
.png)
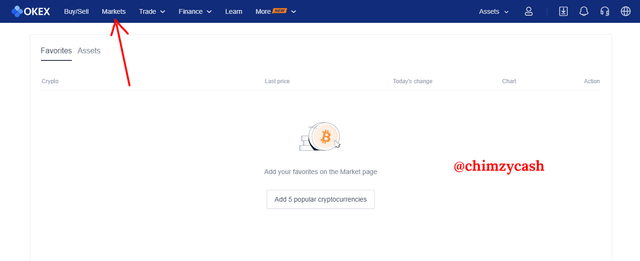
Once the funds is deposited, it is time to go to the exchange interface to purchase MATIC.
Click on Markets
.png)
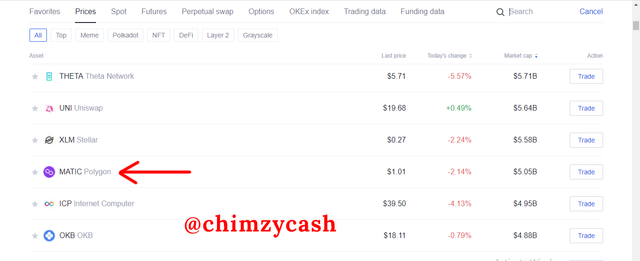
Next, I will choose MATIC because it is the cryptocurrency i want to purchase. by default it is already on the USDT pair which is great for me.
.png)
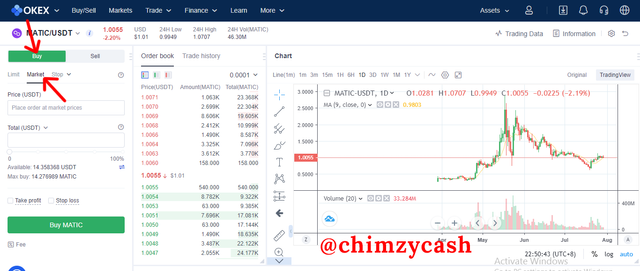
On the exchange interface, On the BUY side,
Click on the markets tab so as to fill the order immediately with the best market price.
.png)
For the amount, I clicked on 100% to purchase MATIC with 100% of my USDT. I was able to purchase 14.27 MATIC with 14.35 USDT based on the best market price.
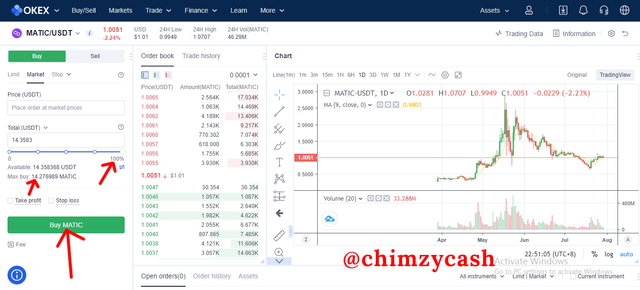.png)
Click on Buy MATIC
On the transaction confirmation page, click on confirm to process the transaction.
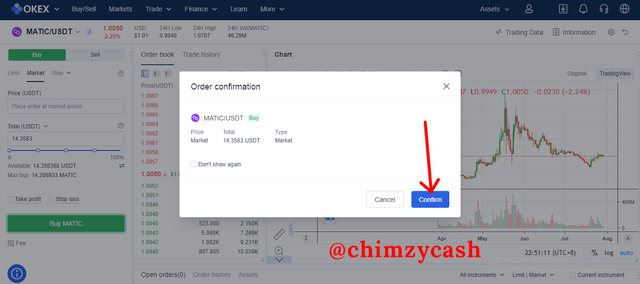.png)
To see the order history, On the order tab, click on buy order history.
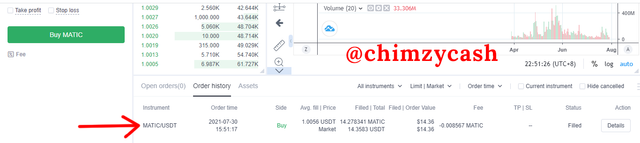.png)
Why I chose Polygon MATIC
Aims to provide solutions - This is one of the main reasons why I chose MATIC. Polygon Matic aims to provide solutions to ethereum and many blockchain projects as well. Polygon was built to provide the much-needed scaling solutions to the ethereum network. Also, it aims to transform Ethereum into a full-fledged multi-chain system. This is one of the things I look out for when choosing any project to invest in. Being able to provide solutions is a great way to stand out and have usecases which is in turn help increases the value of the coin in the long term.
Prices is still below its all-time high - This is another factor that key to making my investment decision. When a solid project like polygon MATIC is still way below its previous all-time-high, it is a great investment opputunity in my opinion because when it reaches its all-time-high in the nearest future, my investment will be in a very good profit.
Solid team - The project team is a very important factor that I look out for before investing in any cryptocurrency. This is important because a project team can make or break a project with great potential. Some projects have great potential but not a great team, which hinders the growth and adoption of the project. Polygon MATIC has an amazing team of highly skilled professionals who are working continuously to provide innovative solutions in the crypto space.
Large community on social media - This is another factor that I consider before making my investment decisions. This is important because a project with a large community on social media would have a lot of attention and exposure that can help increase the value of the project. Polygon has over 535k followers on Twitter which means a lot of eyeballs on the project. They are also active on telegram, discord, youtube, Reddit etc. The more people who know about the project, the more user base, which in turn increases the value of the project and drive the price up.
Quality features - This is super important for me because the features helps to know what makes the project stand out and what they offer. The quality features on polygon was a big factor why I chose to invest in the project. Some of the key features of polygon are;
- ETH Compatibility
- Scalability
- Security
- Sovereignty
- Interoperability
- Modularity
- User Experience
- Developer Experience
Polygon MATIC Market Capitalization
At the moment, Polygon MATIC has a market capitalization of $6,412,435,961 and a fully diluted market capitalization of $7,974,230,659. It has a The currency price is $1.01 with a circulating supply of 6.41 Billion MATIC.
Polygon MATIC rankings
At the moment, Polygon MATIC is ranked 17th on the coinmarketcap and coingecko platforms. With a current marketcap of $6,412,435,961, there is still a lot of room for growth for MATIC. With the potentials and solutions that polygon brings, there is no doubt that polygon MATIC will be much higher up in rankings and has the potential of being a top 10 cryptocurrency in the nearest future.
Project Objective
The main objective of Polygon which is simply a well-structured and easy to use platform is to provide solutions to the ethereum blockchain and for scaling ethereum as well as infrastructure development. Also, Polygon MATIC prides itself as ethereum’s internet of blockchains. Polygon network is a Layer 2 scaling solution with the goal of providing solutions to scalability issues of many blockchains. The polygon platform consists of main components such as Polygon SDK which is basically a modular and flexible framework that provides the ability for different applications development.
Polygon - Team
Polygon is a blockchain and cryptocurrency project that was launched about four years ago, back in 2017. The project was founded by three professionals, it was co-founded by Jaynti Kanani, an experienced blockchain developer, Sandeep Nailwal, also an experienced blockchain developer, and Anurag Arjun, a business consultant. The project team consists of highly-skilled professionals and advisors who share the same goal of the polygon project.
.png)
Project Roadmap
Polygon MATIC project has done well to deliver according to their promises. Polygon MATIC is a fully functional platform that aims to solve ethereum's scalability issues and also provide solutions to other blockchains.
.png)
Purpose of MATIC
MATIC token is a utility token that powers the polygon network. It is an ERC-20 token that serves as the gateway to a Multi-Chain Ethereum. The main purpose of MATIC token is for transaction fees on the network and also staking which a way of securing the polygon network.
Question 2 - Explain in your own words what the "Evening Star" pattern consists of. What is its hit rate?
The Evening Star Pattern
The evening star pattern is one of the many chart patterns that are common when it comes to technical analysis. The evening star pattern is basically a chart pattern known as a reversal pattern. It forms with three candlesticks at an uptrend and is the opposite of the morning star pattern. It shows that there is a slowdown in the upward momentum, before the bearish move that signals that there is a possible downtrend reversal.
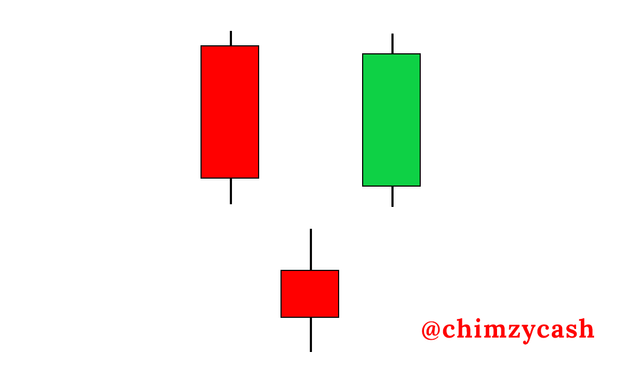
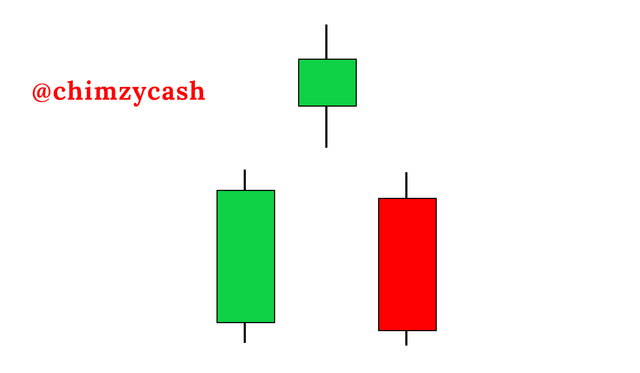
The evening star pattern basically consists of a large body bullish candle, followed by a Doji candle or a small bearish/bullish body candle, followed by a large bearish candle that cuts deep into the first bullish candle. Simply put, The formation of the evening star candle consists of the following components
- It forms at an uptrend
- It forms with 3 candles
- The first candle forms a large body bullish candle
- It is followed by a Doji or a small body bullish/bearish candle
- The third candle is a large body bearish candle
The main psychology behind the formation of the evening star pattern is that, on the bullish candle which shows that the buyers were in control, the buying force drives the price up and closing near the high. The middle candle which can be bullish/bearish shows that the upward momentum is slowing down and also means indecision in the market. The next candle is the bearish candle which shows that the sellers have taken control, the selling force pushes the price down and closes near the opening level of the first bullish candle.
.png)
Based on research, the evening star candle pattern has about 70.2% hit rate which means its success rate is above average, making it a very serious pattern that can signal a potential downtrend.
Question 3 - Explain in your own words what the pattern "Abandoned Baby" consists of. What is the percentage correct?
The Abandoned Baby is also a well-known pattern that can be bullish or bearish. The bullish/bearish patterns are almost visually similar to the morning/evening star patterns, however, they are different and have their own characteristics.
The bullish abandon baby pattern is also known as a bullish reversal pattern. It is a pattern that forms at the end of a downtrend and indicates that there is a potential uptrend. The bullish abandon baby pattern consists of 3 candle components;
- The first candle is a large body bullish candle
- The second candle is a small body candle or a Doji that opens and closes at the same price level. The small body candle has a gap between the first bullish candle before opening and closing.
- The third candle is a large body bearish candle and has a gap between the small body candle before opening and closing.
The main psychology behind the formation of the bullish abandon baby candle pattern is that, on the daily chart, the first large body bullish candle which opens low and closes high shows that the buyers are still in control. The second candle on the next day which forms as a Doji or a small body candle with a big gap away from the first-day candle shows that there is indecision between buyers and sellers. The third candle on the next day which forms with a large body bearish candle shows that sellers are about to take control.
The bearish abandon baby pattern is also known as a bearish reversal pattern. It is a pattern that forms at the end of an uptrend and indicates that there is a potential downtrend. The bearish abandon baby pattern is nothing more than the opposite of the bullish abandon baby pattern. It also consists of 3 candle components;
- The first candle is a large body bearish candle
- The second candle is a small body candle or a Doji that opens and closes at the same price level. The small body candle has a gap between the first bearish candle before opening and closing.
- The third candle is a large body bullish candle and has a gap between the small body candle before opening and closing.
The main psychology behind the formation of the bearish abandon baby candle pattern is that, on the daily chart, the first large body bearish candle which opens low and closes high shows that the sellers are still in control. The second candle on the next day which forms as a Doji or a small body candle with a big gap away from the first-day candle shows that there is indecision between buyers and sellers. The third candle on the next day which forms with a large body bullish candle shows that buyers are about to take control.
The abandoned baby pattern is renowned for being a very rare pattern that is very difficult to find, however, it has a very good track record of signalling a trend reversal. When the abandoned baby pattern is found, it has a percentage success rate of about 80% on average and is regarded as a very powerful trend reversal signal.
Question 4 - Perform analysis for 3 and 7 recent calendar days for Bitcoin Do you identify any patterns?
On the 3days chart of BTC/USDT pair, there were a couple of patterns that were present on the 3day chart.
.png)
Bearish engulfing pattern - This is one of the patterns that was formed on the 3days chart. The bearish engulfing pattern is basically a pattern that can be called a reversal pattern. It forms at the top of the uptrend and indicates that there is a potential downtrend.
Bullish engulfing pattern - This is one of the patterns that was present on the 3days and 7days chart. The bullish engulfing pattern is basically a pattern that can be called a reversal pattern. It forms at the bottom of the downward movement and indicates that there is a potential uptrend.
Doji pattern - The Doji candlestick pattern was present on both the 3days and 7days chart. It basically represents indecision in the market which means that both the buyers and sellers are equal. It can also represent a slow in momentum for an existing upward trend.
On the 7day chart of BTC/USDT pair, there were a couple of patterns that were present on the 3day chart.
.png)
Morning star pattern - The morning star pattern was present on the 7days chart. It is basically a pattern that forms with three candlesticks at the bottom of an downward movement that shows that there is a slowdown in the downward momentum, before the bullish move that signals that there is a possible uptrend reversal.
Doji pattern - The Doji candlestick pattern was present on both the 3days and 7days chart. It basically represents indecision in the market which means that both the buyers and sellers are equal. It can also represent a slow in momentum for an existing upward trend.
Bullish engulfing pattern - This is one of the patterns that was present on the 3days and 7days chart. The bullish engulfing pattern is basically a pattern that can be called a reversal pattern. It forms at the bottom of the downward movement and indicates that there is a potential uptrend.
Conclusion
When it comes to cryptocurrency investments, it is important to do proper fundamental analysis on the project so as to make the best investment decisions. Polygon is one of my favorite cryptocurrency because of its potential to the upside. After my research and fundamental analysis, I made the decision to invest in this project. With its amazing features and solutions it brings, there is no doubt that MATIC is heading to the top. Finally, when it comes to investment and trading, technical analysis is very important. Chart patterns are key elements of technical analysis that can help a trader or investor make the best decisions in the market.
Gracias por participar en la Tercera Temporada de la Steemit Crypto Academy.
Felicitaciones, realizastes un gran trabajo.
Continua esforzandote y espero seguir corrigiendo tus asignaciones.