Steemit Crypto Academy – Season 2 - Week 8 - Post for @fendit

Share your understanding of "Composite Man" and the fundamental laws. What's your point of view on them?
When it comes to technical analysis, there are a lot of strategies and methods that have been developed to help traders capitalize on the market and make more profits. The Composite Man is very popular in the Wyckoff method. The composite man was created by Wyckoff as an imaginary identity of the market. In the theory, Wyckoff proposed that traders or investors should pay attention and learn about the market, in this case, cryptocurrency market as if it was a single entity that is controlling it as this would be much easier for them to follow the trends in the cryptocurrency market.
The composite man represents the big investors who are also known as market makers because of the huge influence in the cryptocurrency market. The ultimate aim is to ensure that these market makers can buy low and sell high in order to accumulate more profit. When it comes to the composite man, there are steps that are used to influence prices movement in the cryptocurrency market which is also known as market cycle. When analyzing cryptocurrency or when performing technical analysis on any cryptocurrency, this cycle becomes very beneficial. According to Wyckoff, there are four main phases when it comes to market cycle which are; accumulation, uptrend, distribution and downtrend.
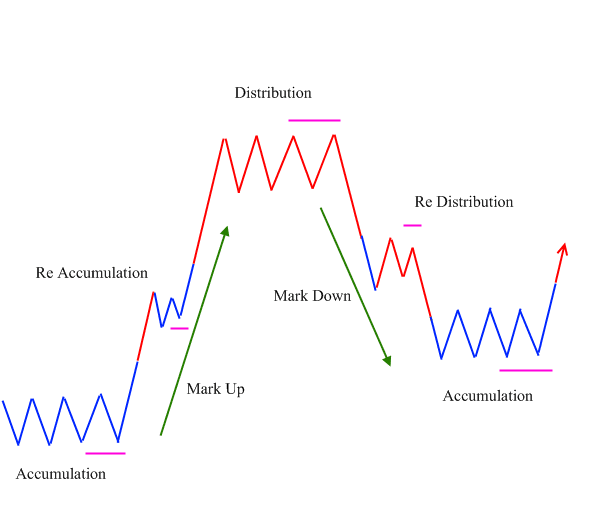
Accumulation
The accumulation phase is basically the phase where there is more demand. In this phase, the big investors or the composite man continues to buy and accumulate the cryptocurrency asset before most investors. Sideways movements of the assets is mostly associated with this phase as in the accumulation phase, the purchases are gradually done so as to ensure that the price does not change significantly.
Uptrend
The uptrend phase is basically where the selling pressure is greatly reduced and the market begins to rise up because the composite man is holding so much assets. When this happens, it is normal for more investors to start entering the market, thereby increasing the demand. It is important to know that in the uptrend phase, there may be experiences of multiple accumulations which means that the bigger trends pauses, corrects and continues to move upwards again. This phase attracts more investors as everyone wants to join and take advantage of the uptrend movement which causes the demand to increase more than the supply.
Distribution
The distribution phase is basically where the composite man begins to take profit by selling some portions of his holdings to new buyers who are entering the market. At this phase, the price is on the high side which makes it profitable for the composite man. Sideways movements is associated with the distribution phase. In the distribution phase where the composite man begins to take profit by selling some portion of his holdings, the demand for the asset begins to reduce until it is depleted causing the price to go downwards.
Downtrend
The downtrend phase is basically the opposite of the uptrend phase as this is the phase that comes after the distribution phase. The composite man is taking profit and selling his holdings, the demand continues to reduce until it is depleted thereby causing the market to move in a downtrend direction as the demand decreases lower than the supply. Much like the uptrend phase, there might be multiple distributions which means that the market might pause, corrects and begins to move downwards again. In this phase, some buyers might fall into the trap of the distributions, hoping for the market to move upwards. However, the market continues to move in the downtrend or bearish direction.
Fundamental laws
When it comes to the fundamental laws, there are three main laws in the Wyckoff method. The three laws are;
Law of Supply and Demand
In this law, when it comes to price of any cryptocurrency asset, supply and demand play a key role. The law of supply and demand shows the relationship between the supply and the demand of an asset to determine the price of the asset. For the price of any cryptocurrency asset to increase, the demand has to exceed the supply. In other words, when the demand is more than the supply, price tends to increase. This is the major reason that determines the trend direction. If the demand is higher than the supply, it results in an uptrend and if the demand is lower than the supply, it results in a downtrend.
The Law of Cause and Effect
In this law, it shows the relationship between the price movements of a cryptocurrency asset and the actions that have been taken in the early stages. In the Wycoff method, the cause is associated with the preparation stages and the effect is associated with the results of the preparation stage. Looking at this law, the accumulation and distribution are the cause and as a result, the market either moves in an uptrend or a downtrend which is the effect of the cause. Simply put, when the market is an accumulation phase (the cause), the market tends to move in an uptrend direction (the effect), and when the market is in the distribution phase (the cause) the market tends to move in a downtrend direction (the effect).
The law of efforts and result
In this law, it shows the relationship between the price changes and volume of the cryptocurrency asset. The change in the price of any cryptocurrency asset is as a result of the efforts. The volume (buying and selling) is associated with the efforts and price or market movement either upwards or downwards is the result. In other words, the relationship between the efforts and the results affects the market trend. When there is a connection between the efforts and the results, there is a continuation in the market trend. If the volume and price of a cryptocurrency asset is low, the trend tends to go downwards. If the volume and price is high, the trend goes in an upward direction.
Share a chart of any cryptocurrency of your choice - Using AAVE/USDT Pair
For this demonstration, I will be using the AAVE/USDT pair. From the chart, we can see the accumulation phase of AAVE when the price was around $420 - $475. We can also see that from the volume, as the volume was almost at equilibrium. The price began to move in an uptrend as the result of the accumulation as more and more investors began to jump into the market and the demand continued to increase. The price of AAVE entered an uptrend phase and increased to about $650. Looking at the chart, we can see that there were multiple re-accumulations in the accumulation phase.
With the price increase, the large investors began to take profit and sell some of their positions, resulting to the distribution phase. From the volume, we can see that the demand was decreasing, which resulted in a decrease in volume. The price entered into a downtrend. We can also see that there was multiple re-distributions as the price continued to move in a downtrend. The price of AAVE fell all the way down to $380.
.png)
AAVE/USDT pair
Accumulation
From the chart, we can see clearly the accumulation phase of AAVE/USDT. The accumulation phase began when the price was around the $480 region. We had multiple re-accumulations in this phase as price continued to fluctuate upwards and downwards. We can also see some sideways movements in the accumulation phase.
Uptrend
From the chart, we can see the uptrend phase which was the result of the accumulations in the accumulation phase. This further proves the fundamental laws of cause and effect. The price began to increase, leading to an uptrend, which is the effect of the accumulations and re-accumulations. Also, the volume shows the increase in the demand of AAVE at which proves the law of demand and supply and the law of efforts and results, the increase in volume and demand, resulted to the price increase.
Distribution
From the chart, we can see the distribution phase. As the market was in an uptrend and the price increased, the big investors or the composite man began to take profit and sell his positions. The demand began to reduce as we can see from the volume. We can also see the re-distributions and a bit of sideways movements in the distribution phase.
Downtrend
As more and more AAVE was sold in the market, the price began to fall and eventually entered into a downtrend. We can see the re-distributions, however, the price continued to move in a downtrend. The downtrend is as a result of the selling pressure and the decrease demand. As the demand was lower than the supply, the price continued to move in a downtrend.
Conclusion
The Wyckoff method has proven to be a very powerful tool for technical analysis that can help investors and traders capitalize on the market trends and make more profit. For me, I like the Wyckoff method a lot, the composite man and the fundamental laws as they have all proven to be really effective and powerful when it comes to technical analysis of any cryptocurrency asset. Understanding the Wyckoff method puts the trader or investor in a very good position to capitalize on the market trends and make more profits.
Thank you for being part of my lecture and completing the task!
My comments:
Your explanations were good, but there are several mistakes when identifying the pattern in the chart. The uptrend looks weird and the re-accumulation period has very rough variations when it comes to price and volume, so that's not completelly ok.
Overall score:
5.5/10