Heikin-Ashi Trading Strategy - Steemit Crypto Academy | S4W2 | Homework Post for @reddileep
It is described as a Japanese candlestick-based technical trading tool, it is utilized to contradict the market trend signal as well as predict movement of price.
The heikin-ashi technique employs normal price information that assists to filter out the market rackets. The candlestick chart is used to represent and picture out information about jacket price data.
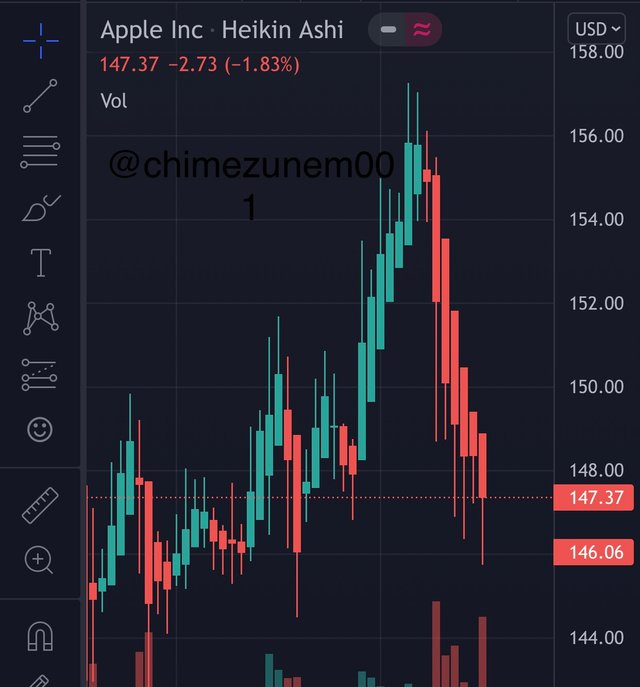
the heikin-ashi screenshot from trading view
This technique started all over the 1700s by munehisa Homma. The breakdown of the term heikin indicates average and that of Ashi indicates Bar. Coining both words together we can say that it means AVERAGE BAR.
Therefore the technique creates a smoother chart making it simpler to sport trends and change. The heikin-Ashi as well outlines unknown gaps and some price data.
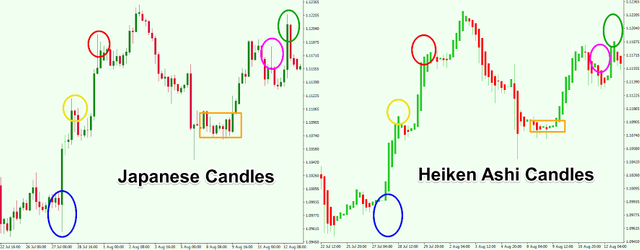
There are differences between the traditional candlestick and heikin-ashi chart which is the latter that makes use of a modified procedure that is established on both periods moving average rather than open, high, low, and close price.
In trading, the day by day shutting down of price is a very crucial metric. The specific data after the day has ended is crucial. These data can be noticeable in a traditional candlestick chart which shows a definite value still not found in the heikin-achi chart but utilize the average of the value of two periods. Let take a look at some major differences which are
- it is extremely hard to analyze charts on Japanese candlesticks reasons is that because the color often changes from green to red.
While in the heikin-ashi it is clear because ashi chart presents more succeeding colored candles aiding the trade to spot out the last movement in a clearer way.
- Secondly, heikin-ashi enables traders to explore market trends more clearly. Again lessen noise on the chart which now makes it look very smooth in terms of price action.
While a traditional candlestick visualization of price action is rough.
- thirdly the traditional candlestick the closing price are disclosed day-to-day.
While in the heikin-ashi the day-to-day closing price is avoided from been known. In simple words hides the price.
THE HEIKIN-ASHI FORMULA
To calculate the formula, the open-close data from the past period along with the open-high-low-close data from the present period. Below is the formula and how it's been calculated
Heikin-ashi close =[open0+high0+low0+close0/4
Which is the (OHLC) at the top.
Then the heikin-ashi open= Heikin-ashi open (-1)+HA close(-1) /2 which is the [OC].
HA high=max [highO, HA openO, HA closeO ]
HA low = min [lowO, HA openO, HA closeO]
Where
- HA - keikin-ashi
- -1- prior period figure
- O- current period figure.
Heikin-ashi open is fixed at the center of the body of the past bar all-time. Likewise, the heikin-ashi close is evaluated as the average price of the present bar.
TREND AND BUYING OPPORTUNITIES USING HEIKIN ASHI.
Here are few problems you ought to know about when utilizing the heikin-ashi method. It greatly gives obvious signs on-trend and buying opportunities. They are many but Let look at two of them which are the uptrend and downtrend.
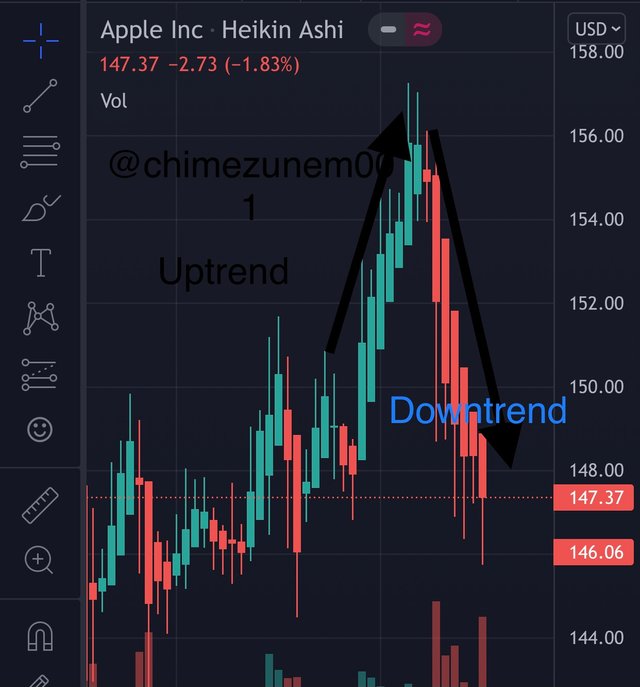
UPTREND:
it shows green candles which Means that it was red before this clears you that the price is about to go up and also gives a chance for you to buy.
DOWNTREND:
when you open your chart and see candles have turned to red, you have to take note that it was green before. So, by this process, you bear in mind that the price is about to drop. This is a clear chance for you to sell.
The above mentioned is very crucial whenever you want to enter a tree due to how they make the market speed up this aiding you to known when to enter a market as well as to buy and sell.
Is it possible to transact only with signals received using the Heikin-Ashi Technique? Explain the reasons for your answer.
I will start by saying that the market is tense and no one is an expert when it comes to trading. My opinion is that it is not advisable to depend only on one signal. My answer to the above question is no.
My reason is that in other to be successful in trading make use of other techniques it's is better to utilize the heikin-ashi at the same time with another indicator like EMA, RSI, etc by so doing you are applying risk management. In trading, you need a signal and a confirmation which you can handle by two different indicator.
DEMO TRADE USING HEIKIN
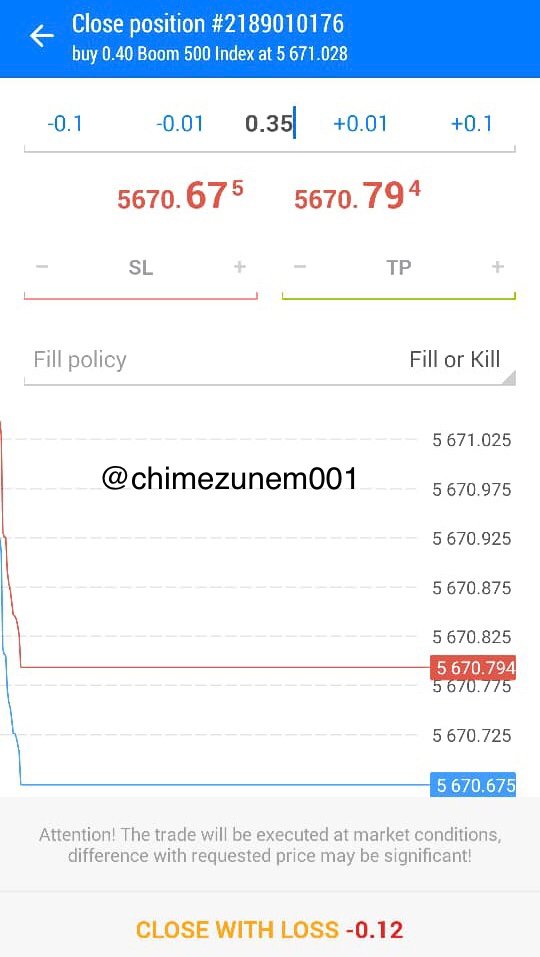
I carried out my buy and sell order using a MT5 account I place a trade by buying boom 500 them waited for a while to get a spike,
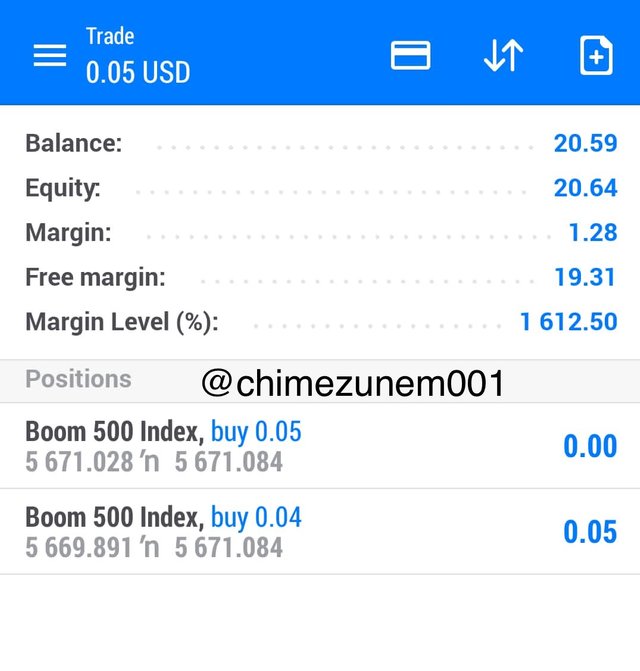
This is my profit
Thanks for reading through
Cc: @reddileep