Crypto Trading With Chaikin Money Flow Indicator - Crypto Academy S4W6 - Homework Post for professor @ kouba01
chaikin money flow
The Chaikin money flow (CMF) was named after the inventor whose name is Marc Chaikin. Around the 1980s was when the indicator was invented to regulate the accumulation as well as distribution of an asset over a specified period.
To set the CMF the default period should be 20 or 21 days. Also, the spectrum at which the indicator read is in the middle of +1 with -1. If any crosses are noticed above or below 0 it can be utilized to spot reversals in money flow and purchasing or selling momentum.
Additionally, the indicator is used for technical analysis to interpret measure money flow volume over a set timeframe.
When there is a buying pressure it can lead to positive readings over 0. Maintained selling of an asset drags the indicator below 0. When the Chaikin money flow swings right over the 0 lines, this will signify that the buying and selling pressure is equal.
CMF can be utilized as a way of assisting measure change in purchasing and selling pressure as well as assisting to expect potential changes and along these lines open trading opportunities

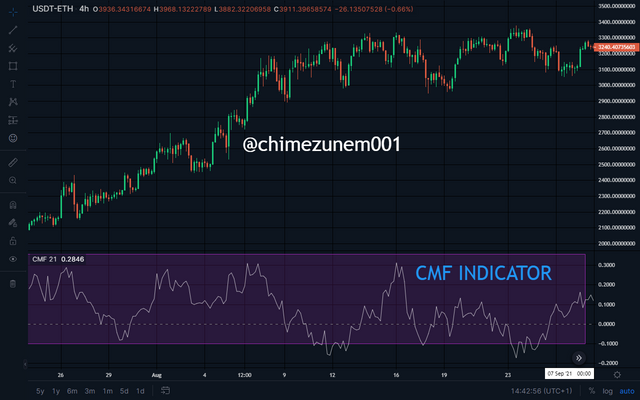
the CMF indicator from tradingview
calculating Chaikin money flow
To calculate the value of Chaikin money flow the following 3 steps are utilized.
- money flow multiplier
This is the initial step and it's to decide every period money flow multiplier.
Money flow multiplier is equal to (close value- low value)-(high value-close value) / by high value -low value.
- The second step is money flow volume
To do your calculation here the volume of money flow will be multiplied by the volume of the period by the money flow multiplier collected in the initial step.
You can calculate it daily, however, can be figured in any case like week after week or hourly. Mathematically it will be
Money flow volume = money flow multiplier * volume for the period.
- The last step is the Chaikin money flow.
To calculate the value for CMF, divide the daily money flow above a certain time frame by the total volume for the same period.
For Chaikin money flow the default number of the period is 21 days, this signifies the trading above the previous month. There are 21 or 22 trading days in every month. Below is the procedure
CMF=21 days average of the daily money flow/ 21-day average of the volume.
how to add the indicator other than trading view.
I used the global.bittrex.com
https://global.bittrex.com/home/markets
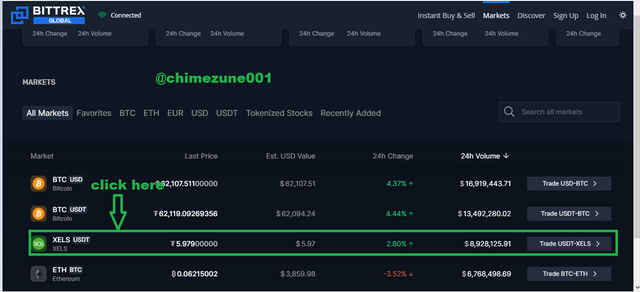
I clicked on market and chart them chose the pair xels/usdt.
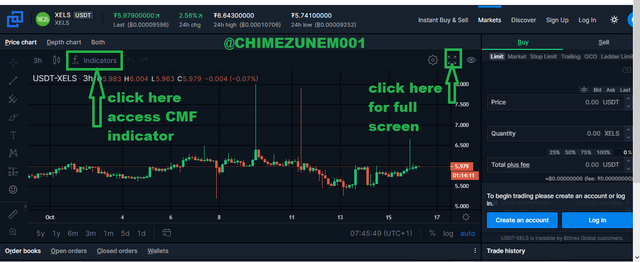
I clicked on the fx indicator icon to assess my cmf indicator.
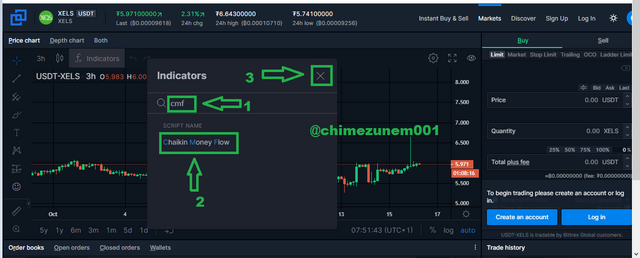
I clicked on search and I typed cmf and added it
This is the cmf indicator
modifying the setting
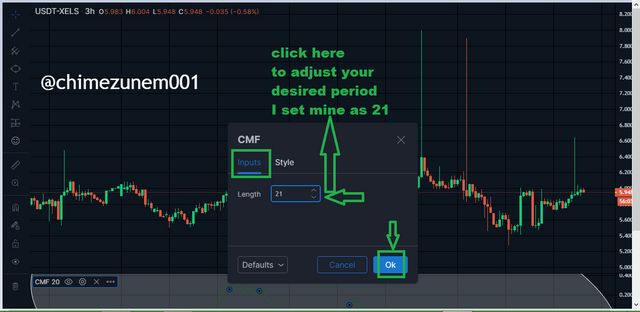
I clicked on inputs and insert my length as 21 which is the standard-setting to use the cmf indicator.
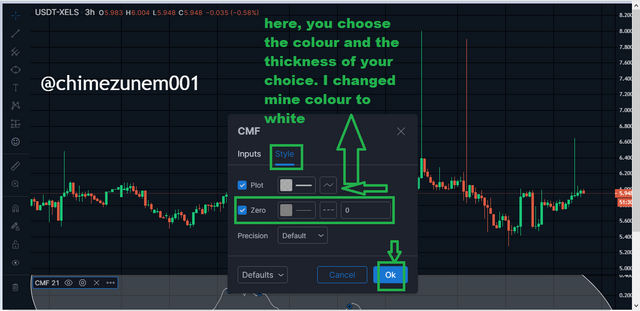
Here is the style how you want your indicator to look the color and thickness I choose white and clicked ok.
What is the indicator’s role in confirming the direction of the trend and determining entry and exit points (buy/sell)؟(screenshot required)
This is simple to confirm the value of the Chaikin money flow. When it is over 0 it signifies that the asset is in a bullish trend, again when the value of CMF has gone below 0 it interprets that the asset is a bearish trend.
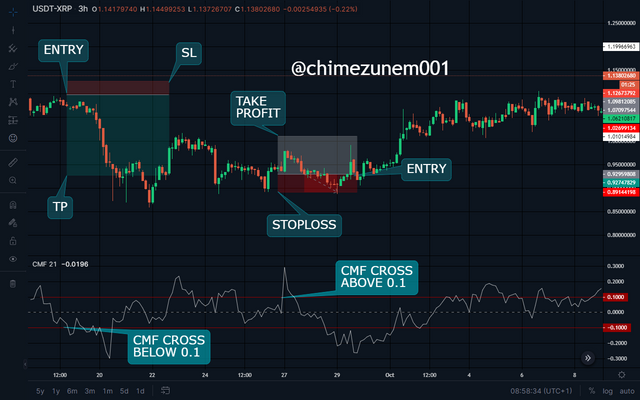
entry point
When the indicator moves over 0 it telling a trader that is due time for buying pressure at this time the trader can enter the market.
exist point
Here when you notice that the value of CMF has begun to push down below 0 this is signifying selling pressure. At this point, you can comfortably exit the market.

In simple words and looking at the chart above you find the arrow marked with green just crossed the line above 0 which Is a clear entry point or buy.
Looking closely again you see an arrow marked with red is pushing down and suddenly crossed the 0 level which is a clear exist point or sell.
trading with cross over signals between the cmf and wider lines such as +1- 0.1 or +/-0.15 or +/-0.2. Identify the most important signals that can be gotten using several example.
The outcome to purchase and sell lies on the indicator when it reaches the 0 level line to +0.1 this means that it a buying pressure as well as when it is below the 0level line to -0.1 it signals a selling pressure
Looking closely at the cmf indicator you notice that the midline is been crossed numerous producing many signals of buying and selling. These give bogus signs to traders. This bogus indication can cause a trader to lose such a great amount on the lookout.
trading with divergence in the middle of Chaikin money flow and price line
It simply means when the value of the asset is not changing position in the same direction with the value of Chaikin money flow.
When this happens it signifies that the ongoing trend is almost coming to an end and could be possible for the trend contradiction.
The two types of divergence are bullish and bearish divergence.
bullish divergence
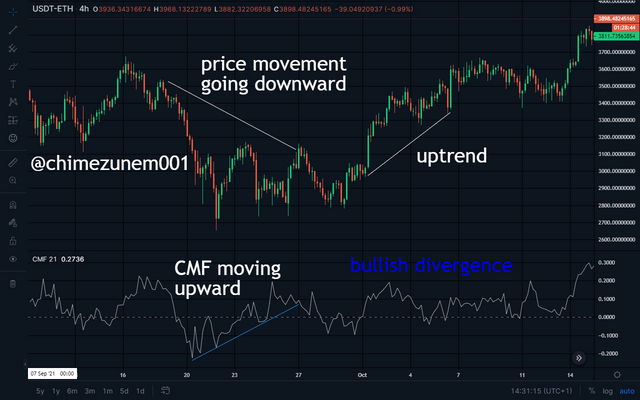
This signifies a possible upside alteration is coming. This happens when the price tumbles to a new low however the Chaikin money flow doesn't take strategy accordingly with a lower reading.
When there is a solid trend momentum a new high price will be indicated in a related new high reading on the CMF.
bearish divergence
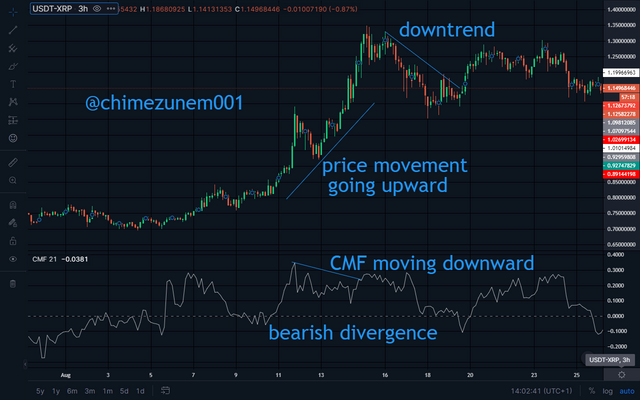
Bearish divergence happens when price action comes up short on a relating change in the CMF indicator. Also, this is when the price pushes to a new high yet the CMF reading doesn't go higher when there is a solid momentum, a new high price will be indicated in a related current high reading on the CMF.
does divergence trading produce false signals
My answer to this question is yes reasons is because no indicator is 100% accurate when utilized alone.
False signals can be induced with the use of CMF divergence.
in conclusion
The Chaikin money flow indicator can be utilized to differentiate if there is a buying or selling pressure in the market.
Thanks for reading through.
Hi @chimezunem001
Thanks for participating in the Steemit Crypto Academy
Feedback
Total| 5/10
This is average content. Your article lacked an in-depth analysis of information regarding trading with the Chaikin Money Flow Indicator.
Thanks professor @yohan2on for the feedback I think there is a mistake you wrote 5 instead of 6
Sorry for that but it was meant to be a 5.