CRYPTO ACADEMY SEASON4/ WEEK4/ CRYPTO TRADING WITH WILLIAMS %R INDICATOR, HOMEWORK POST FOR @KOUBA01

the Williams %R indicator is likewise called the Williams percentage rate indicator or in acronyms WPR indicator.
It is a technical indicator employed while trading to indicate the momentum of a trend, too utilized to get another trading signal which will be mentioned as we keep moving. It moves in the middle of 0 and -100 as well as measuring overbought and oversold levels.
The benefit of utilizing the Williams%R indicator while trading is that it supports the trader to effortlessly find both the entry and exit points in the market.
In other words, both the williams%R indicator and stochastic oscillator is a replica, utilized the same way too. The indicator was established by a man who trades commodities known as larry Williams around 1973. He created numerous indicators but the WPR happens to be the best among all.
CALCULATING THE WRP INDICATOR.
The Williams %R indicator is been calculated by utilizing the procedures below.
Williams %R = highest high -close/ highest high-lowest low.
Hence the highest high is equivalent to the highest price in the look-back. Period 14days.
Accordingly close = the most current closing price.
The lowest low is = lowest price in the look-back. Period still 14 days.
With the above formula, it is calculated relying on price, usually in the course of the last 14days.
Williams %R review the level of the close relative to the high-low range throughout a given timeframe. Take for instance the highest high is equivalent to 108. The high-low range is 10 this 110 -100 being the divisor in the %R formula.
The highest high less the close is equivalent to 2 (110-108) which is divided by 10 coming about in 0.20. Duplicate this number by -100 to get -20 for %. On the off chance, the nearby was 103, Williams %R would be -70 (110-103)/10)*-100).
HOW IT WORKS
the indicator alerts a trader where the present price is relative to the highest high over the previous 14 days. When the indicator is between between-20 and 0 it alerts the trader that the price is overbought or let's look at it from another angle when it gets closer to the high of its present-day price range.
Also when the indicator is in between -80 and -100 the price is oversold on the other hand far from the high of its present-day range.
During a bullish period, traders can pay attention to the indicator watching it to see if it will move below -80. When the price take-off and the indicator shifts back above -80, it could signal the trader that the bullish period want to start again leaving the trader with a choice to sell or not according to their plan.
The same is applicable to locate short trades in a downtrend. When the indicator moves more than-20, watch for the price to start doing down together with the Williams %R moving back below.-20 to let a trader known that in In the future the downtrend may continue.
THE BEST SETTINGS
The best is when you use 14 periods as the length. It is believed that the setting worked for the creator of the indicator when he applied it.
The setting can be for days, weeks, months, or an intraday timeframe. The 14 period %R setting would employ the present close, as well as the highest high over the last 14 periods And the lowest low over the last 14 periods.
Additionally, the 14-period setting is regarded as the favorable reason is that the maker programmed it to be the standard-setting.
INTERPRETING OVERBOUGHT AND OVERSOLD SIGNALS WITH THE WILLIAMS %R WHEN TRADING CRYPTOCURRENCIES.

Williams %R makes it simple to discern overbought and oversold levels. The oscillator size is from 0 to -100 regardless of how quick a security advance or collapse Williams %R will consistently change inside this range.
In simple words, overbought is when a reading is above -20 while the reading below -80 is oversold.
In addition, all overbought signifies the price is close to the highs of its present range the same goes to oversold the price is close to the lows of its present range.
Both overbought and oversold reading does not ensure that the price will overturn.
WHAT ARE FAILURE SWINGS AND HOW YOU DO DEFINE IT USING WILLIAMS%R
In trading, swing failure refers to a type of about-turn pattern, which is utilized as a buy or sell signal. In a bullish period, there is a sequence of successive higher highs as well as higher lows still there will be a time when the price drops to make a current high. In a bearish period, price fall to make a current low.
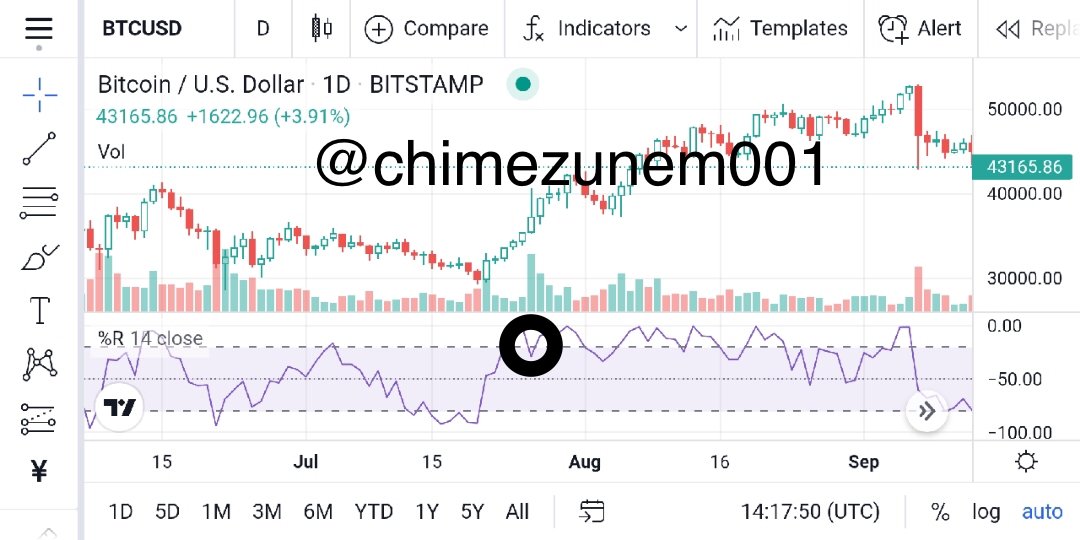
In the case of Williams %R, the failure swing is a swing set to make the indicator surge in an uptrend period but fails to reach the high lines which are (-20%) or fall in a downtrend yet fails to drop to the lowliness which is the (-80%) we look at it as a failure swing.

From the chart above take a look at the spot I marked the price failed to reach the previous height.
HOW TO USE BEARISH AND BULLISH DIVERGENCE WITH THE WILLIAMS % R INDICATOR? WHAT ARE IT MAIN CONCLUSION?
Both uptrend and downtrend divergences notice with the Williams %R signals gives a crucial chance and it's reasonable looking out for these divergences obtaining the Williams %R.
THE BULLISH DIVERGENCE

This happens when the Williams %R establishes an uptrend while the price falls simultaneously. This tells us that the seller is developing weak and the price pattern might invert. In this way, there is a conceivable opportunity for purchasing.

The same is related to the bearish divergence but in an opposite direction therefore it happens when the Williams %R establishes a downtrend while the price is gaining simultaneously.
This shows that the purchaser is been frightened and thus price pattern might actually invert. Subsequently it a potential selling opportunity.
MAIN CONCLUSION ON DIVERGENCES
Williams%R is exceptional when it comes to spotting trend contradiction employing divergences as it shows the period of drawback in a trend. Whenever there is a decent possibility of a contradiction the trader can make a good choice utilizing this either to buy or sell trade believing on the divergence.
HOW DO YOU SPOT A TREND USING WILLIAMS %R AND HOW ARE FALSE SIGNALS FILTERED.
A trend is considered when a moves in a specific direction over a period. Trends can either be long or short-term. In other to detect trends using the Williams%R it is suggested that you utilize it alongside another indicator like the RSi, EMA, etc.

Here the price is going down which is a clear chance to buy.
To filter out false signals I think the trader should do some affirmation utilizing other sold indicators.

USE A CHART OF ANY PAIR TO PRESENT THE VARIOUS SIGNALS FROM THE WILLIAMS %R INDICATOR.
Looking at the can't below utilizing the Williams %R, a future buy signal is illustrated, and there is a strong oversold situation as a result of the price been in -80 and -100 this shows a strong buy entry.

The point I marked is indicating a buy signal. After buying you can set your take profit and wait for the price to hit your spot so you can make a profit
Once the price hit this level looking at the point you bought from the first chart you have made much profit.
FINAL TAUGHT
The Williams % progresses in the middle of 0 and -100. Overbought is determined by a reading that is above -20 while oversold is reading below -80.
The Williams %R indicator help traders to locate entry and exit point in the market, thus making it look, utilized the same way with the stochastic oscillator.
Thanks for reading through