Understanding Trends II - Crypto Academy / S5W3- Homework Post for @reminiscence01
Hello guys, I welcome you all to my blog as I participate in Season 5 Week 3 of the steemit Crypto academy lessons and especially that of our respected Prof @reminiscence01 on "Understanding Trends II". Let's get started guys...

a) Explain your Understanding of Trend Reversal. What is the benefit of identifying reversal patterns in the Market?
b) How can a fake reversal signal be avoided in the market? (Screenshot needed).
Overview of Trend Reversal
Trends are what traders see as their friend as this is the only quick way to have a representation of an underlying buy and sell activities of an asset via a chart analysis. Just as we know, no trend continues in a particular direction as the cryptocurrency market is saddled with highly volatile trade activities which come with Retracements, Continuation, Range, etc. All these parameters can be observed in the bear or bull market as the case may be for a given underlying asset.
Trend reversals are very important trade signals that place traders in the path of profit trading and adequate trade positions. An understanding of this trading tool would guide traders when to anticipate a possible trend reversal as well as wait for a valid break before making a sell or buy order. This simply involves a change of price trend signals from bullish to bearish or bearish to bullish as the case may be. This helps the trader identify when a trend is nearing exhaustion; that is the end of a trend and the beginning of a new trend.
Bullish Trend Reversal
In a typical bullish market where we observe the upward movement of price action, there are stronger activities of buyers than sellers with the creation of Higher-Highs levels. But there are points where price actions can no longer sustain this upward push which invariably means that sellers are getting hold of the trade. Now, in this case, price trends are unable to create highs above the previous High created. A trader that identifies or observes this signal should be able to anticipate possible market Trend Reversal in the opposite direction (Bearish).
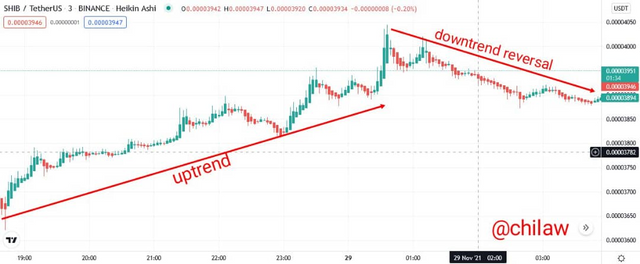
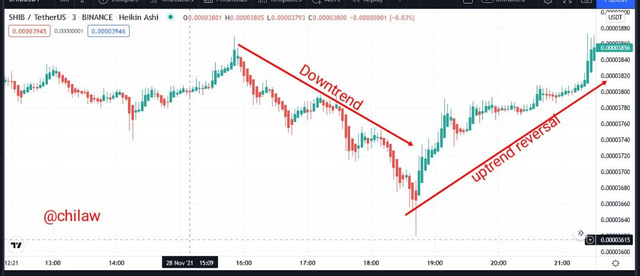
Bearish Trend Reversal
Just as opined for the Bullish Trend Reversal, it is the opposite scenario for the Bearish Trend Reversal. In a typical bearish market where we observe the downward movement of price action, there are stronger activities of sellers than buyers with the creation of Lower-Lows levels. But there are points where price actions can no longer sustain this downward push which invariably means that buyers are getting hold of the trade. Now, in this case, price trends are unable to create Lows below the previous Lows created. A trader that identifies or observes this signal should be able to anticipate possible market Trend Reversal in the opposite direction (Bullish).
Benefits of Trend Reversal
- The benefit of Trend Reversal is an important and integral trading tool for the trader as this is a strategy that reduces the amount of risk exposure in a trade if applied.
- Traders can now easily know trend exhaustion as well as the beginning of a trend in a given time frame of an underlying asset
- It is a guide to know how best to make trade positions in a given market cycle. Therefore, in a given market where the scenario is either Bullish or Bearish, we are expected to anticipate the opposite direction to make it the buy or sell order position.
- When used in combination with other indicators, it filters the noise from the market or fakeouts in trade.
- Scenarios where divergence is observed, traders are observed to either wait for a valid break or use indicators like the RSI to confirm price actions before making trade positions.
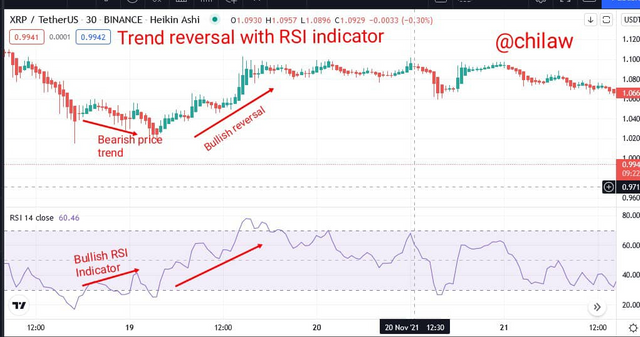
b) How can a fake reversal signal be avoided in the market? (Screenshot needed).
Avoiding fake reversal signals in the market is an important trading strategy every trader has to put in use while reading chart analysis. This can be avoided by the use of additional indicator(s) to chart analysis. For instance, I will be using the RSI indicator on the price trend movement to help filter some of the fakeouts in trade. This can be simply seen when both the price trend and the RSI indicator are corresponding.
Give a detailed explanation on the following Trend reversal identification and back up your explanation using the original chart. Do this for both bullish and bearish trends (Screenshots required).
Break of Market Structure
In our knowledge about the performance of Price trends, no trend is observed to follow a permanent direction be it the Bullish or Bearish trend. But before price trends are distorted as expected for either a bullish or bearish trend, we have the Price Trend Continuation which aligns itself to a market structure where price action is viewed to follow a particular pattern. These particular patterns are observed to be the Market structure for that underlying asset for that given time frame.
This pattern suggests that there is a definite activity of market players in the underlying assets at that given time. If we have the buying pressure more in a given time, the market structure would follow a definite pattern of the presence of higher-highs and higher-lows. This is the reverse for Selling pressure which comes with a pattern where there is the formation of Lower-Lows and Lower-Highs.
But when we have scenarios where the dominant force sustaining the market structure can no longer hold trend in its initial direction, hence the Break of Market Structure. When it occurs in an uptrend (Break in market structure), we anticipate a trend reversal in the opposite direction (bearish). When it occurs in the Downtrend (Break in market structure), we can only anticipate a trend reversal in the opposite direction (Bullish).
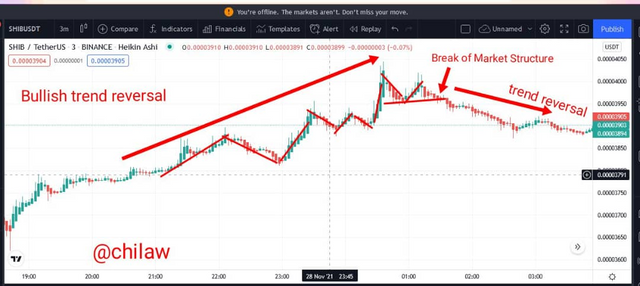
Break of Market Structure _ Bullish Scenario
Therefore we may have scenarios where this price continuation or market structure is bullish in its movement where higher-highs are formed as well higher-lows. Every subsequent high was observed to be higher than the previously attained high and also the current low level higher than the previous low level. But there is a point where the dominant buyer's pressure can no longer sustain the upward movement, hence a possible trend reversal and break of the ongoing market structure in place. Trend direction is observed to now follow the bearish way which is opposite to the previous bullish trend.
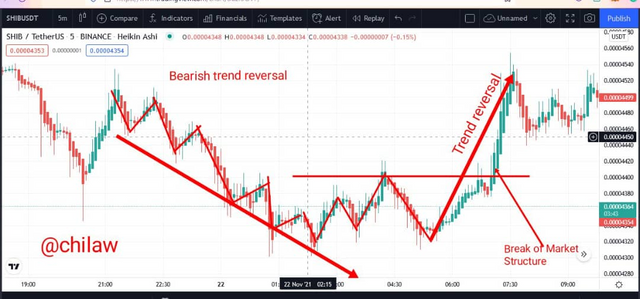
Break of Market Structure _ Bearish Scenario
This is the opposite scenario of the Bullish market structure break. Therefore we may have scenarios where this price continuation or market structure is bearish in its movement where Lower-lows are formed as well lower-highs. Every subsequent low was observed to be lower than the previous attained low and also the current high level lower than the previous low level. But there is a point where the dominant Sellers' pressure can no longer sustain the Downward movement, hence a possible trend reversal and break of the ongoing market structure in place. Trend direction is observed to now follow the Bullish way which is opposite to the previous Bearish trend.
b) Break of Trendline.
This very important technical analytical tool just as explained in the previous lessons helps in guiding traders on how best to determine the price direction of an asset over a given time frame. They act as dynamic supports and resistance levels so far these trends remain valid. A trend can only be valid when it keeps rejecting the trendline each time it comes in contact with it.
But a break in the trendline is usually observed when this dynamic support or resistance points created by the trendline are broken by price trends. These usually come with strong trend reversals either seen as bullish or bearish reversals which every proactive trader should look out for.
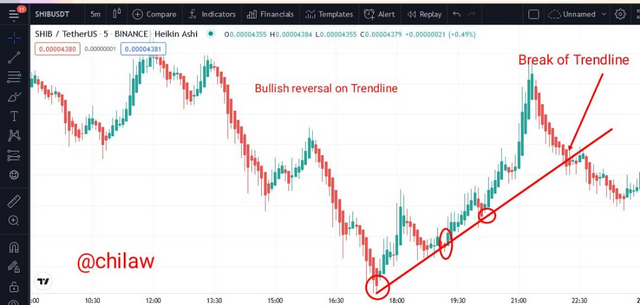
Break of Trendline_Bullish Scenario
In the bullish scenario where we have the Break of Trendline, the trendline is drawn below the price trend and the trendline is observed to act as dynamic support to the trendline. A possible and anticipated break of the trendline is observed to occur with the price trend breaking through the trendline and headed bearish. At this point where a valid break is observed, traders are expected to take trade position.
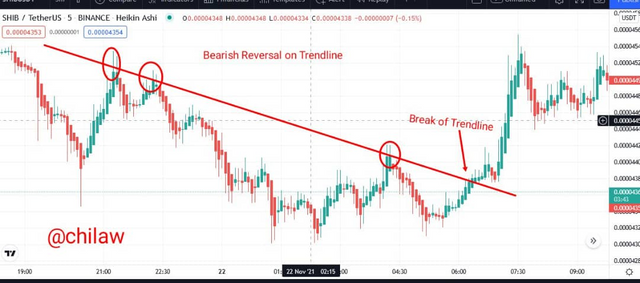
Break of Trendline_Bearish Scenario
In the bearish scenario where we have the Break of Trendline, the trendline is drawn above the price trend and the trendline is observed to act as dynamic resistance to the trendline. A possible and anticipated break of the trendline is observed to occur with the price trend breaking through the trendline and headed bullish. At this point where a valid break is observed, traders are expected to take trade position.
c) The Divergence
This is another way to identify trend reversal in a market and hence traders are expected to capitalize on this trading signal so as to make an informed trade position during the trade. Divergence simply means a scenario where the direction of price trend does not correspond with that of the indicator trend used. This can either be observed in a bullish or bearish form where trend reversals can also occur with price trend and indicator line not corresponding initially in their signals.
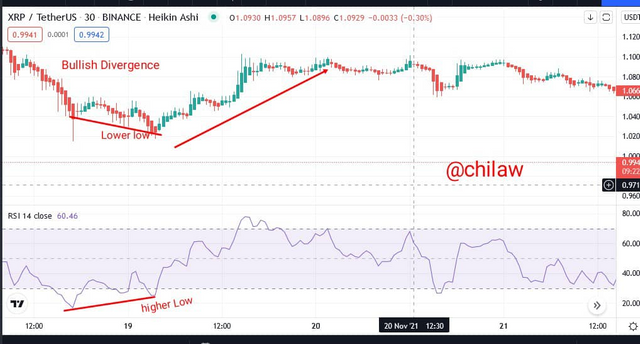
Bullish Divergence
In a typical bullish scenario, we observe that the price trend of an underlying asset is on the Lower-low level with the indicator line making a higher high on the other hand. What this invariably means is that there would like to be a trend reversal in the opposite direction which is in the bullish trend. Therefore, traders should be able to use these trade signals early enough to either sell off an already open position as well as make a new buy position for the much-anticipated bull run.
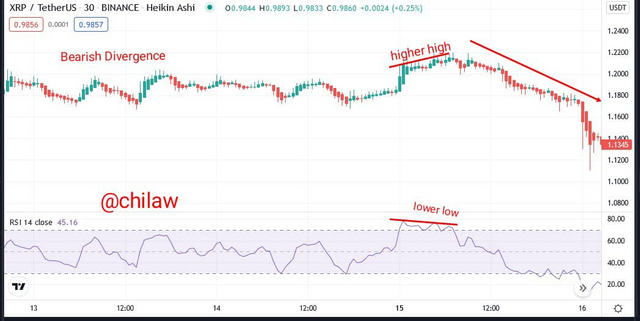
Bearish Divergence
In a typical bearish scenario, we observe that the price trend of an underlying asset is on the higher-high level with the indicator line making a lower-low on the other hand. What this invariably means is that, there would like to be a trend reversal in the opposite direction which is in the bearish trend. Therefore, traders should be able to use these trade signals early enough to open positions as well as make a sell position for the much-anticipated bear run.
d) Double top and Double bottom
This has a basis with the market structure formation where we have a bullish trend forming a higher-high and the bearish trend forming the lower-low levels. In scenarios where this formation is not in tandem with the anticipated trend direction, we observe a retracement or retest in price action. The double top and double bottom formation are seen in the uptrend and downtrend movement respectively.
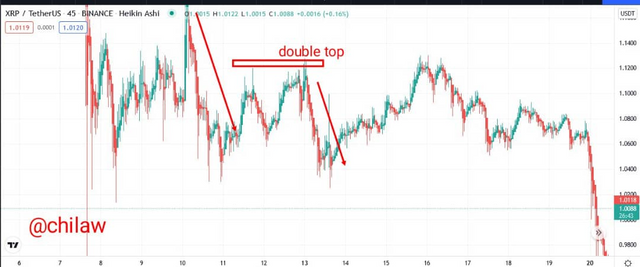
Double Top
This is a market structure formation that is found in the Bullish trend of an underlying asset represented in chart analysis. In this scenario, we have a high point attained after which the price trend retraces and as well continued in the same bullish trend. But the new high point formed is observed to be at some point seen for the previous high lemel of this given asset, hence the formation of a double top. This is a valid trend reversal that is anticipated each time we have such formation or pattern in occurrence and hence traders are expected to leverage on these signals to make a proactive trade position.
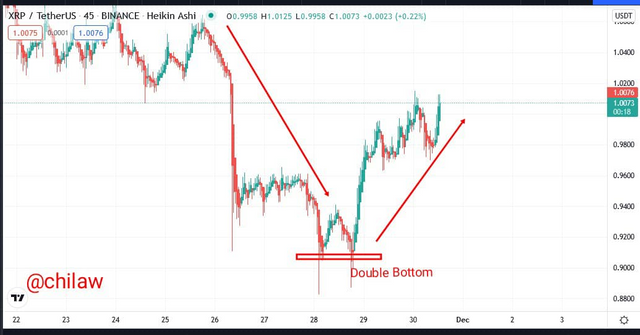
Double Bottom
This is a market structure formation that is found in the Bearish trend of an underlying asset represented in chart analysis. In this scenario, we have a low point attained after which the price trend retraces and as well continued in the same bearish trend. But the new low point formed is observed to be at some point seen for the previous low level of this given asset, hence the formation of a double bottom. This is a valid trend reversal that is anticipated each time we have such formation or pattern in occurrence and hence traders are expected to leverage on these signals to make a proactive trade position.
place a demo trade using any crypto trading platform and enter a buy or sell position using any of the above-mentioned trend reversal/continuation patterns.
XRP/TetherUS_45Mins Time Frame
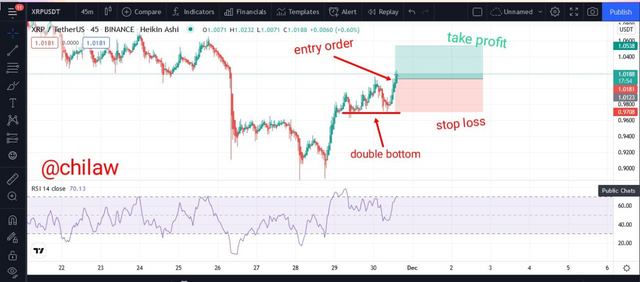
This was demonstrated using the double bottom trend reversal signal. After an initial double bottom structure, the price trend was observed to be bullish before another reoccurrence of a double bottom market structure. Trade entry order was placed where we observed a valid trend break at 1.0188 (at the higher-low point where trend retraced before forming the second bottom). Risk Reward ratio of 1:1 was used with stop loss at 0.9708 and take profit at 1.0538.
Conclusion
Trend reversals are important trading strategies implored to give traders first-hand trading opportunities to make unformed trade positions geared towards maximizing profits. They are usually observed to occur after a series of higher highs or higher lows for bullish trends or Lower lows or lower highs for bearish trends after when trend exhaustion occurs. These are levels where buyers or sellers can no longer persecute the dominant force to sustain trend direction at a given time frame.
Thank you respected prof for your lessons this week.
Note that all images used in this post were screenshots from the trading view site done through my mobile device.
Hello @chilaw, I’m glad you participated in the 3rd week Season 5 of the Beginner’s class at the Steemit Crypto Academy. Your grades in this task are as follows:
Recommendation / Feedback:
Thank you for participating in this homework task.