Ultimate oscillator indicator- Steemit Crypto Academy- S5W8-Homework post for @utsavsaxena11
Hi Steemians, I hope we are doing just good from our different locations especially now we have breaks of variants all over the globe. Notwithstanding, I welcome you all to my blog as I participate in this very last week of the season 5 lessons as presented by prof @utsavsaxena11 on Trading with Ultimate Oscillator.
Question 1:
What do you understand by the ultimate oscillator indicator? How to calculate the ultimate oscillator value for a particular candle or time frame. Give a real example using chart pattern, show complete calculation with accurate result.
The Ultimate Oscillator Indicator
Just like every other discussed technical indicator, the Ultimate Oscillator is also a technical indicator in the category of existing Momentum indicators available for traders' use. It was developed by Larry Williams sometime in 1976 to guide traders/investors on how best to read trade signals with limitations given to multiplicity of signals which most times are the drawbacks observed in momentum indicators relative to false signals.
The Ultimate Oscillator Indicator gained more adoption and usefulness due to its uniqueness of having effects on Volatility as well as produces fewer signals which makes it more filtered with fewer fakeouts. Moreso, different time frames can be used on this indicator but with variations observed while calculating the expected values. Shorter time frames are observed to have weighted calculation indices vis-a-vis using the longer time frame with the same Ultimate oscillator indicator.
It is somewhat related to the readings of the relative strength index (RSI) where two different level points are viewed as leverage points where signals are anticipated. In simple terms, the Ultimate Oscillator Indicator has a reading of 0 -100 where Band reading of 0-30 is observed as Oversold regions and Bands 70-100 represent the Overbought regions where there likelihood of an anticipated trend reversal.
Most importantly, it uses the use case of Divergences in its readings. We have the Bullish Divergence and the Bearish Divergence where price trends are observed in opposite directions with the indicator readings. The Bullish divergence is observed to mean that the trader should anticipate a Buying signal while making trade positions whereas the Bearish Divergence is to Selling Signals respectively.
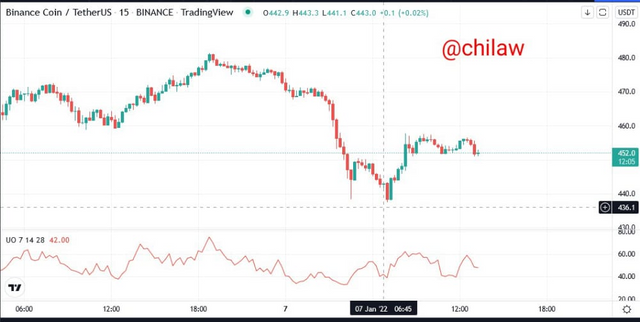
(image from tradingview site)
Calculating the Ultimate Oscillator Value
I will be making this calculation as much simple I can for easier comprehension. We already know the formula listed from the lessons;
UO = 100 x [(4 x A7) + (2 x A14) + (4 x A28)] / (4+2+1)
Where A7 = Average of 7 periods, A14 = Average of 14 periods and A28 = Average of 28 periods.
where;
Average 7 = (7 periods BP sum)/7 Period TR sum
Average 14 = (14 periods BP sum)/14 Period TR sum
Average 28 = (28 periods BP sum)/28 Period TR sum
BP (Buying Pressure) = Close - Min(Lowest value of Current Low or Previous Close)
TR (True Range) = Max(Highest Value of Current High or Previous Close) - Min(Lowest value of Current Low or Previous Close)
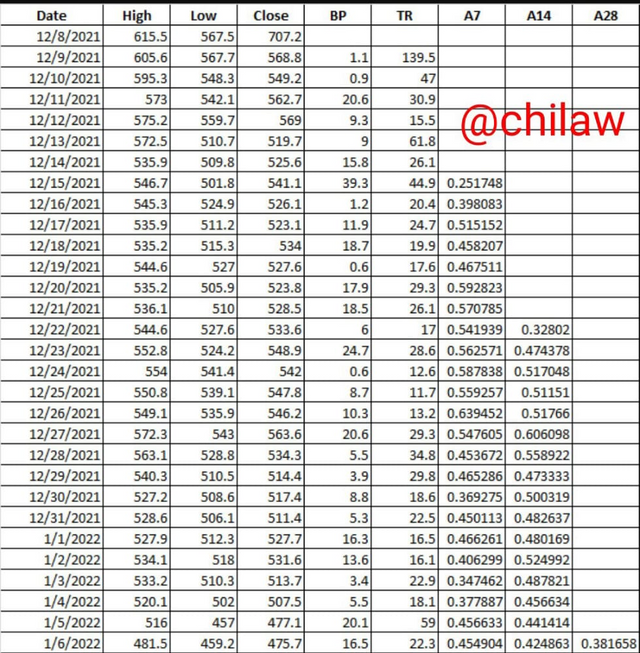
With values derived from the BNB/USDT chart analysis and the with the introduction of the Ultimate Oscillator indicator, the following parameters like the Close, High and Low were observed and used in the derivation of the BP and TR values respectively. This also in extension gave the values for A7, A14 as well as the A28 periods.
For example in calculating the UO on the 6th January 2022, we can see the following derived values from the excel sheet.
6th January 2022:
A7 - 0.454904
A14 - 0.424863
A28 - 0.381658
UO = 100 x [ (4 x A7) + (2 x A14) + (A28) ] / (4+2+1)
UO = 100 x [4 x 0.454904) + (2 x 0.424863) + 0.381658 ] / 7
UO 100 x [ 1.83616 + 0.849726 + 0.381658 ] / 7
UO = 100 x [ 3.067544 ]/7
UO = 100 x 0.43822
therefore UO = 43.822
How to identify trends in the market using an ultimate oscillator. What is the difference between the ultimate oscillator and slow stochastic oscillator?
Identifying Trends in the market using Ultimate Oscillator
Trends in the market can either be observed in the Upward direction or in the Downward direction. Since we already know the modus-operandi of the Ultimate Oscillator which has a reading of 0 -100 bands and as well indicating the Overbought and Oversold respectively, it is much easier to tell where the trend is headed at every given period. The Overbought region is usually observed between the band readings of 70 and above whereas the Oversold region is observed between the band readings of 30 and below.
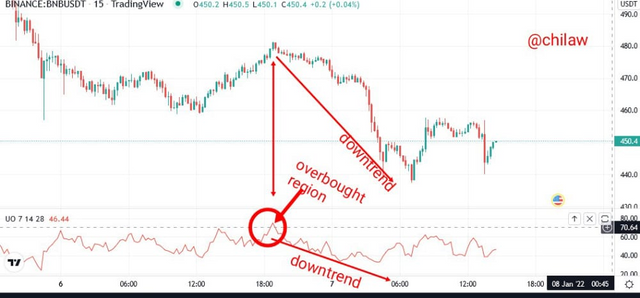
(Downtrend identification_Image from tradingview)
Therefore for one to identify a Downtrend using the Ultimate Oscillator, the indicator trend should be found in the overbought region where price trend is observed to be in band readings of 70 and above, and hence there is an anticipated trend reversal towards the downward direction.
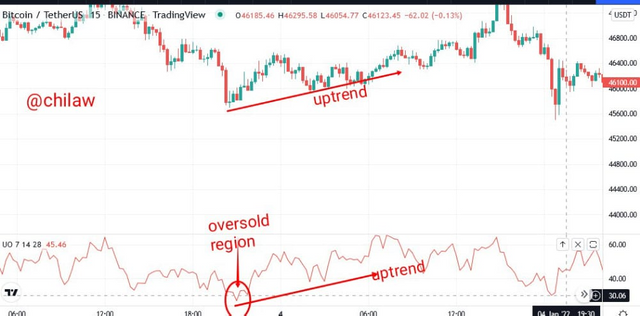
(Uptrend identification_Image from tradingview)
On the other hand for the Uptrend trend identification, indicator readings are found in the oversold region where band readings are observed to be between 30 and below and hence there is an anticipated trend reversal towards the Upward direction.
Difference between the Ultimate Oscillator & Slow Stochastic Oscillator
These two indicators have some similarities no doubt but were created for a different concept/Ideology. They both represent Momentum indicators in their category with the resemblance in the band readings of 0 -100 which represent overbought and oversold regions depending on the side in which the trend is observed at the moment.
Here are some of the important differences found between these indicators:
| No | Ultimate Oscillator | Slow Stochastic Oscillator |
|---|---|---|
| 1. | Presence of three (3) time frames while in use which includes the 7, 14, 28 | Presence of just one or two-time frames in its reading concept (14 and 3 periods) |
| 2. | There are more filtered signal while using the Ultimate Oscillator due to the presence of different time frames | There are more likelihood of false signals in the use of the slow stochastic oscillator |
| 3. | There is less presence of trade Volatility while using this indicator and hence provides fewer signals void of fakeouts through its divergence signals | Effect of more market volatility are experienced with the use of this indicator and hence there are more likely to provide false signals. |
| 4. | Presence of 3-step-verification steps in use before the divergence signals can be said to be valid which is a more reliable trade position to use | There is no such valid confirmation in its reading |
| 5. | No presence of the use of signal line except combined with an additional indicator as support | Presence of Signal line which makes it a lot more reliable in its readings. |
| 6. | Presence of only one oscillating line in chart analysis | Presence of two oscillating lines in chart analysis |
| 7. | Precise reading for Overbought & Oversold regions are 70 & 30 respectively | Precise reading for Overbought & Oversold regions are 80 & 20 respectively |
How to identify divergence in the market using an ultimate oscillator, if we are unable to identify divergence easily then which indicator will help us to identify divergence in the market.
Identifying Divergence in the MArket using Ultimate Oscillator
The creator of this indicator Larry Williams was conversant with the fact that momentum indicators are prone to providing false signals but the only way to reduce this drawback was the use of more than one-time frame in its development. The Ultimate Oscillator indicator comes with the 7, 14, and 28 periods time frame which makes it react less volatile to market and as well provides fewer signals but is slow to provide an early signal.
In confirmation of a valid divergence signal using the Ultimate Oscillator is observed by the use of a 3-verification- steps before entry or exit positions can be authenticated.
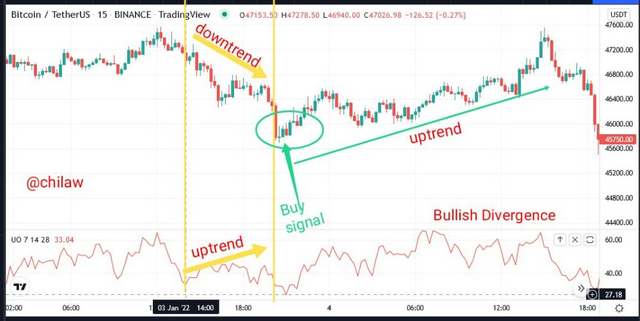
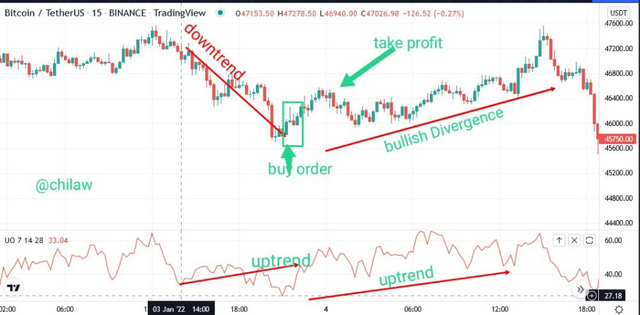
(Buy signal_Bullish Divergence: Image from Tradingview)
For a BUY SIGNAL which represents an Entry position into the market would see that there is a bullish divergence where the price trend is making a lower low signal whereas the Ultimate Oscillator indicator is making a Higher high position. The Lower-low signal presence must be first observed in the Oversold region and the indicator line seen above the divergence high.
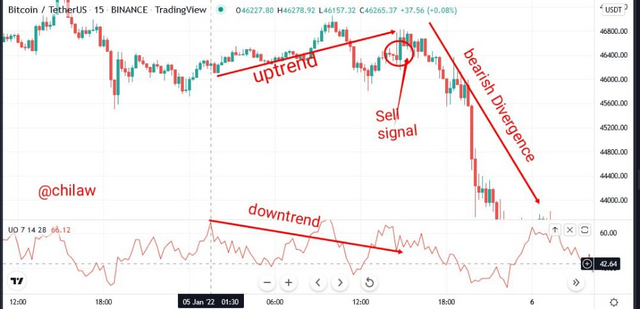
(Sell signal_Berish Divergence: Image from Tradingview)
For a SELL SIGNAL which represents an Exit position in the market would see that there is a bearish divergence where the price trend is making a Higher-high signal whereas the Ultimate Oscillator indicator is making a Lower-low position. The higher-high signal presence must be first observed in the Overbought region and the indicator line seen below the divergence low.
Confirming Divergence signals by combining Ultimate Oscillator & RSI indicators
The RSI is also another momentum indicator that uses the overbought and oversold regions and band readings. This is to give a confirmatory and valid signal while using the Ultimate oscillator indicator in typical chart analysis for a bearish Divergence as observed in the image below.
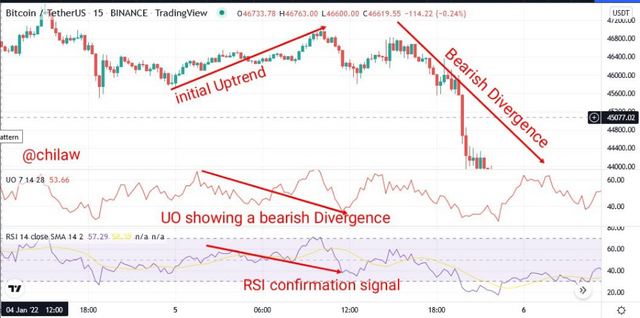
(Combining RSI & UO indicators: Image from Tradingview)
Price tren was observed in a bullish trend whereas both indicators used in the chart analysis were observed in the opposite bearish direction. This simply shows a bearish divergence that anticipates that the market would correct itself by making a trend reversal towards the downward direction. Traders/Investors who observe this signal early make a sell order position to take profit before the market losses its value.
What is the 3 step- approach method through which one can take entry and exit from the market. Show real examples of entry and exit from the market
From my explanations from the Buy and sell signals as attended in the above question, this partly answers what we have here. Nevertheless, I will be listing the market scenarios that guide each of these trade positions.
Market Entry Position - Buy Signal
Market trend is observed in the downward direction with lower-lows signals but the Ultimate Oscillator indicator is observed in the opposite direction with more pressure upward with a higher-high signal. This entails more buying pressure in the view given to the signals from the indicator.
The Signals from the Indicator should be first observed from the oversold region which where indicator band readings are below 30. This guarantees a rebound in that market is at its lowest point and there is more buying pressure than selling pressure.
Lastly, the indicator should be observed above the divergence high which is in the overbought region to confirm a valid bullish divergence scenario.
Market Exit Position - Bell Signal
Market trend is observed in an Upward direction with higher-high signals but the Ultimate Oscillator indicator is observed in the opposite direction with more pressure Downward with a Lower-low signal. This entails more selling pressure in the view given to the signals from the indicator.
The Signals from the Indicator should be first observed from the overbought region which is where indicator band readings are above 70. This guarantees a rebound in that market is at its peak point and there is more selling pressure than buying pressure.
Lastly, the indicator should be observed low the divergence high which is in the oversold region to confirm a valid bearish divergence scenario.
What is your opinion about the ultimate oscillator indicator. Which time frame will you prefer how to use the ultimate oscillator and why?
From the concept f the developer, no doubt that the Ultimate Oscillator turned out to be more reliable given the fewer signals it provides which simply shows low affinity to market volatility. With the use of thee three different periods all embedded in its reading, this makes it easier to remove fakeouts and false signals from its outcomes. Its inability to produce fewer signals is much sustainable in taking a trading position as well less sensitive in reacting to market forces.
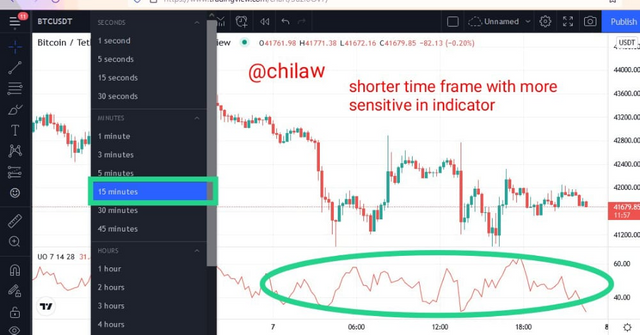
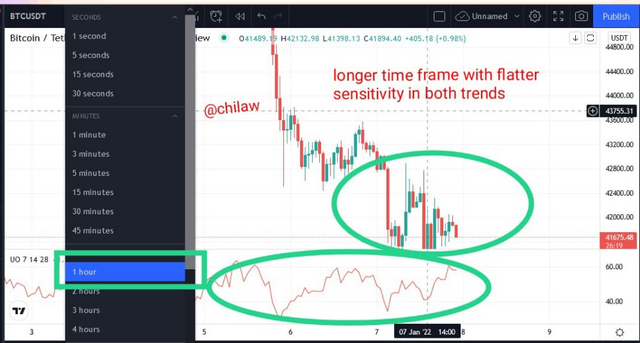
I observed that when the time frame is increased, the indicator lines becomes flattered which removes the presence of sensitivity completely which is observed to be less in the indicator, therefore it is rather to maintain a shorter time frame while using the default period settings of 7, 14, & 28 respectively. Shorter time frames of say 1 to 15 minutes would rather enhance and encourage quick and day trading, unlike higher time frames.
Traders who may prefer to use higher time frames may likely reduce the default settings to maintain the little sensitivity or signals observed while using this indicator.
My general take is that a shorter time frame while using the default settings of 7, 14, & 28 would give a better market signal capable of taking the trade so far the 3-step-verification rules are considered for both buy and sell signal during its divergence outcomes. Nevertheless, no indicator is perfect or standalone, hence a combination of other indicators would rather enhance the performance of the Ultimate oscillator indicator.
Conclusion
The Ultimate Oscillator Indicator is a near-perfect indicator that has poised in providing a more accurate signal to allow traders to take trade positions. It was created by Larry Williams with a modern concept different from the old and existing momentum indicators. It comes with three different period time frames which are observed to produce less signal in trade activities with less affinity to market volatility and extension low sensitivity to market forces.
This in essence removes possibilities of false signals and fakeouts from trade activities as captured in chart analysis with more precision to producing accurate divergence signals. In confirming valid buy and sell signals via the divergences, the three-step verification rules must be considered as taught in the class.
Thank you professor @utsavsaxena11 for your lessons for week 8, hope to see more of your lessons in the next season.
Gracias.
Note that all images used are screenshots from the tradingview site.