[Crypto Trading Using Zig Zag Indicator]- Crypto Academy /S6W1-Homework Post for professor @kouba01
Hey friends, welcome to my blog. I will be participating in this week's lesson delivered by professor @kouba01 on Crypto Trading Using Zig Zag Indicator. I hope you enjoy my entry.
Show your understanding of the Zig Zag as a trading indicator and how it is calculated?
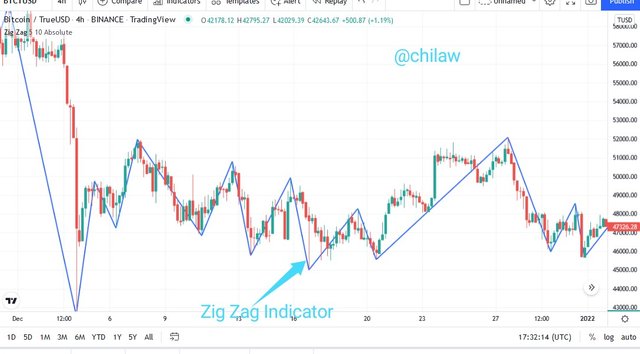
The Zig Zag Indicator is a Trading tool used in chart analysis with a diagonal and zebra pattern/structure with Peaks and Lows or Bottoms and Tops. An indicator that connects swing highs and swing lows of price action. This trading tool helps in the quick identification of important market effects relative to price action while filtering nonsignificant market noises for better trading signals.it measures the percentage change of price actions through its settings.
The presence of Swing Highs and Swing Lows if connected with two or more points with a horizontal line in the upper or lower area of the chart analysis are potential Resistance and Support levels for trading signals. These resistance and support levels are price zones where there presence of heavy but and sell activities and hence determine the bear and bull trend reversal anticipated.
If we watch its pattern or structure, it completely eliminates smaller market effects observed as swing high and lows with bigger swings captured. It enables a better analytical approach to historical data but is not sufficient enough to speculate future price trends. Therefore the next swing high or low can't be determined by this indicator.
It has default settings of 10 and 5 for the Depth and Deviation parameters respectively and with the Backstep of 3 as settings.
Zig Zag Indicator in a glance
- Trend based indicator used in identifying trends in chart analysis
- Filters noise by ignoring small market Swings and hence gives smother signals
- Its swing points (peak and lows) are potential Resistance and Support levels
- Helps in identifying entry and exit points in a given trade setup
Calculating Zig Zag Indicator
This is done by knowing the required parameters and drivers of the indicator. We have the Swing points, Percentage Change of price action, etc.
So ZigZag = (Swing Point, %Change = MP, Retrace = False, Lastextreme = True)
What are the main parameters of the Zig Zag indicator and How to configure them and is it advisable to change its default settings? (Screenshot required)
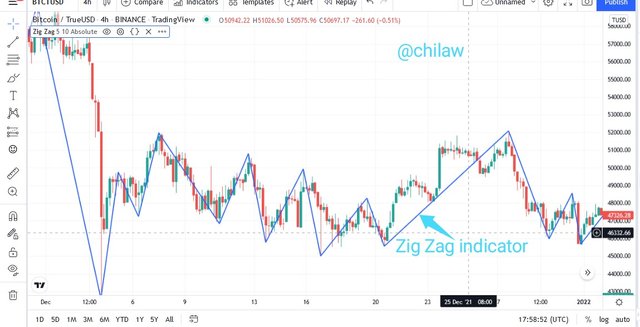
The Zig Zag Indicator Settings comes with default settings: the Depth and Deviation which are all set at 5 & 10 bands respectively. Though this setting can be tweaked to one's individual use, it is eminent to know that this distorts the signal given which hitherto makes the indicator either less sensitive or more sensitive.
The Depth parameter is observed as the minimum of the available candles on the Zig Zag Indicator line that wouldn't make the Peaks or lows of the process happen if the first number is deemed necessary.
The Deviation parameter in this case is the minimum number of points this time that has a representation of the percentage high and low of candlesticks. This affirms the fact that the Zig Zag Indicator does not pick up insignificant signals and market effects of the market.
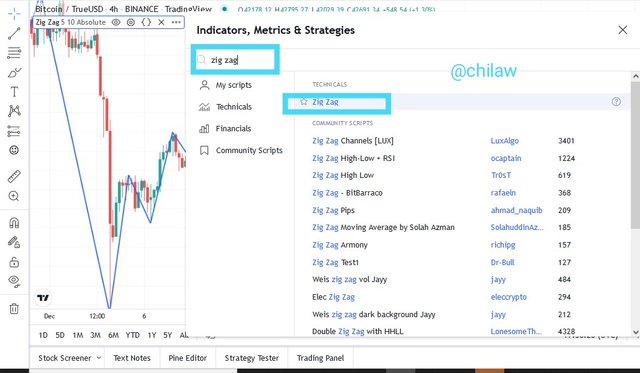
Configuring the Zig Zag Indicator
This can be quickly done through the tradingview site. Launch it, click on indicators, search for the indicator's name, and click on it to launch the indicator.
Changing Default Settings
This is usually dependent on the individual and what works best for him. Every trader has their trading style and inclination on what drives their profitability. Hence we must know that adjusting the default settings either creates less or more l sensitivity in the indicator which brings about false signals.
Changing the deviation settings creates fewer points of this Zig Zag structure and hence a wider spread of its line.
Based on the use of the Zig Zag indicator, how can one predict whether the trend will be bullish or bearish and determinate the buy/sell points (screenshot required)
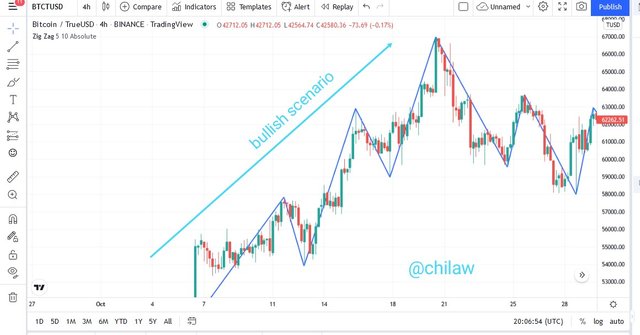
ZigZag Bullish Scenario
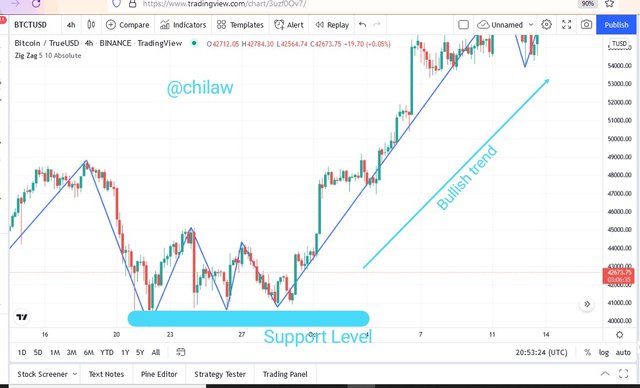
When there is a bullish scenario, it is accompanied by Higher-High and Higher-Low. When this peak happens, it is observed that the current peak is higher than the previous Peak. This is also the same for the swing low point observed. Current swing low points are observed to be higher than the previous swing low point.
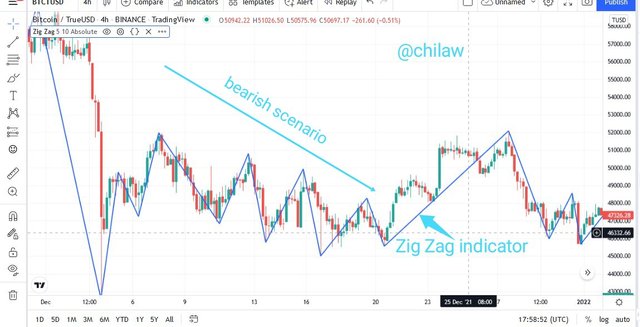
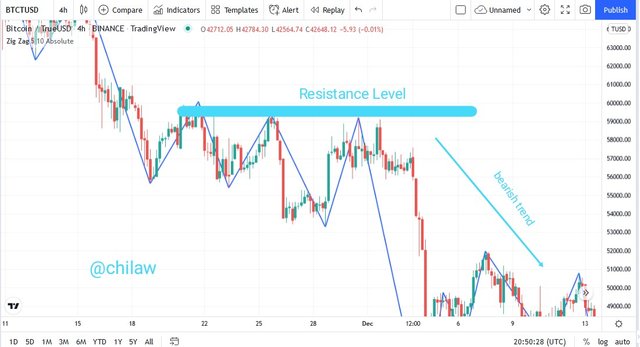
ZigZag Bearish Scenario
When there is a bearish scenario, it is accompanied by lower-Low and Lower-Low. When this peak happens, it is observed that the current peak is lower than the previous Peak. This is also the same for the swing low point observed. Current swing low points are observed to be lower than the previous swing low point.
In determining a sell or buy signal using the Zig Zag Indicator, we have to know that bullish trends are associated with buy signals and bearish trends associated with sell signals.
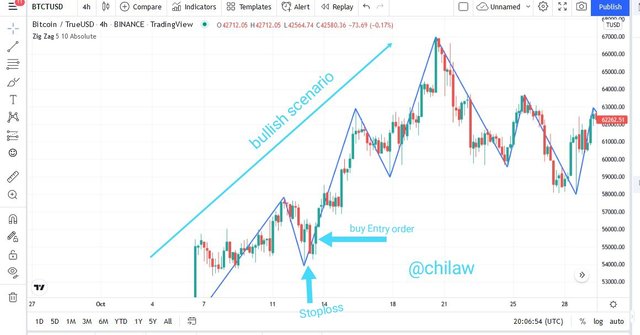
Buy Signal using Zig Zag Indicator
A buy signal is executed in a zig-zag indicator when the next Low point is usually the formation of the longest wave (3rd wave) which is observed to be higher than the previous low point. A clear valid candlestick is selected for a buy entry order. The Stoploss is set below the low point of swing low level.
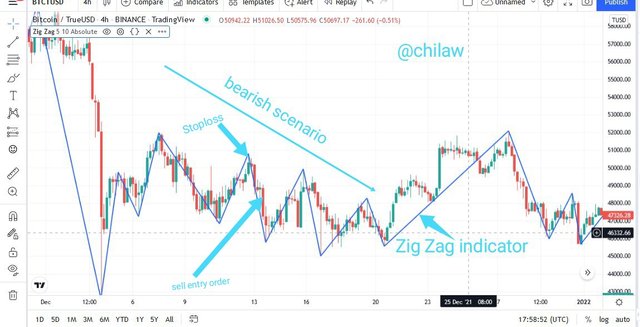
Sell Signal using Zig Zag Indicator
A sell signal is executed in a zig-zag indicator when the next Peak point is usually the formation of the longest wave (3rd wave) which is observed to be lower than the previous peak point. A clear valid candlestick is selected for a sell entry order. The Stoploss is set above the peak point of the swing Peak level.
Explain how the Zig Zag indicator is also used to understand support/resistance levels, by analyzing its different movements.(screenshot required)
Support and Resistance levels are very key signals required by traders to make trade positions. They are strong price zones that are characterized by strong activities of buying and selling. In either of the scenarios, we may have either Buying activities more than Selling activities which we may term High Buying pressure. But when we have more selling activities than buying activities, we may say we have more selling pressure. These scenarios in earnest are potential trend reversal levels, it can be bullish trend reversal for High Buying pressure or Bearish trend reversal for High Selling pressure.
Therefore, the Resistance level would have at least two points at the peak side of the chart analysis where the price trend keeps making a rebound each time it gets to this zone. When this repeatedly happens, it shows high selling pressure which makes for the Bearish trend reversal seen.
While for the Support level, it should also have at least two points at the Low side of the chart analysis where the price trend keeps making a rebound each time it gets to this zone. When this repeatedly happens, it shows high Buying pressure which makes for the Bullish trend reversal seen.
How can we determine different points using Zig Zag and CCI indicators in Intraday Trading Strategy? Explain this based on a clear examples. (Screenshot required))
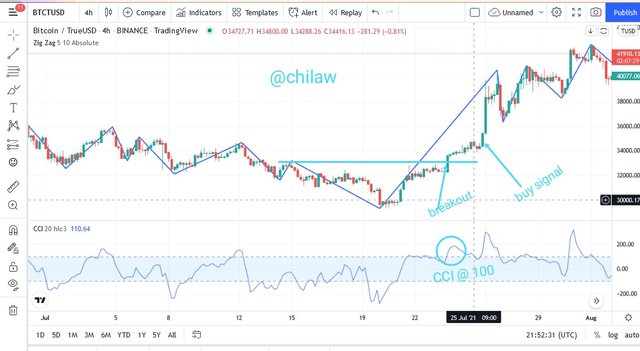
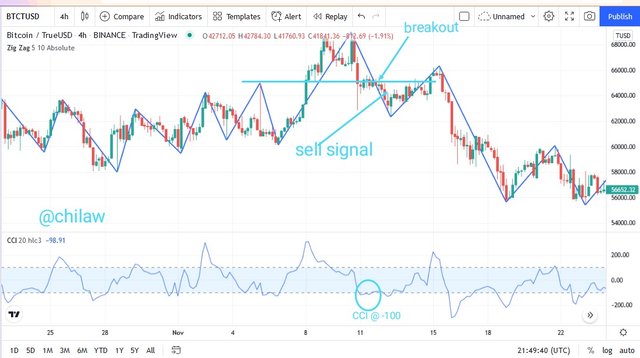
The Zig Zag Indicator can be combined with other indicators for better performance. The intraday trading strategy that entails we have to choose medium and long periods while trading using the Zig Zag Indicator would be more efficient using the BREAKOUT strategy. The breakout strategy is simply that point where the corrective wave breaks and closes above or below the previous peaks or low points.
Lets us look at the CCI indicator which is categorized under the oscillating indicators. It is calibrated with emphasis on its overbought and oversold levels. Overbought levels are calibrated between 0 to 100 whereas the oversold levels are calibrated between 0 to -100.
Therefore in confirming trade positions using this, we should be able to take into cognizance when the Zig Zag Indicator must have formed the number 5 wave and the breakout should be when the wave "c" closes and above or below the previous swing point of wave "a". The CCI indicator should be correlating with this breakout by either above the 200 calibrations or below the -100 calibrations.
For the uptrend illustration, we should have wave C close and above the previous wave A to guarantee a breakout. The Stoploss should be set anywhere between the previous swing low point of wave B and the breakout point.
For the downtrend illustration, we should have wave C close and below the previous wave A to guarantee a breakout. The Stoploss should be set anywhere between the previous peak point of wave B and the breakout point.
Is there a need to pair another indicator to make this indicator work better as a filter and help get rid of false signals? Give more than one example (indicator) to support your answer. (screenshot required)
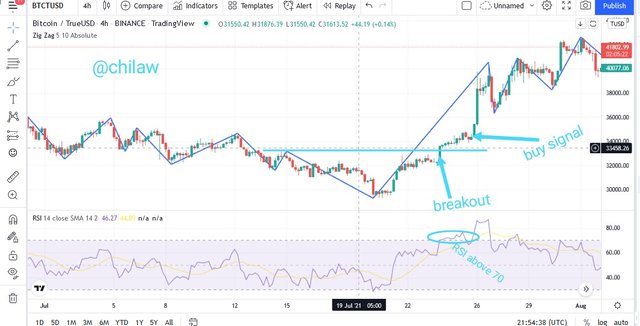
Zig Zag & RSI indicator
The principles would be applicable for the Zig Zag indicator where the breakout strategy would be used and the RSI indicator which uses the readings of 0-100 would be taken into consideration. Where 70 to 100 are for the overbought level and 0-30 for the oversold levels.
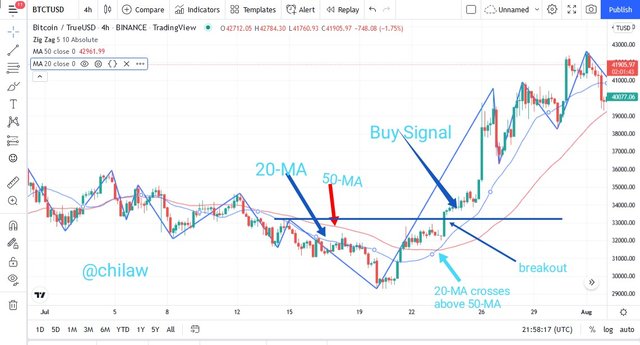
Zig Zag & SMA indicator
The principles would be applicable for the Zig Zag indicator where the breakout strategy would be used and the SMA which uses two Moving Averages (MA). When the short period MA crosses above the Long MA, a bullish trend is confirmed but when the Long MA crosses the short MA, a bearish trend is observed.
List the advantages and disadvantages of the Zig Zag indicator:
Advantages of Zig Zag Indicator
- Its swing points (peak and lows) are potential Resistance and Support levels which are better trade signals to take orders.
- Helps in identifying entry and exit points in a given trade setup due to its breakout strategy
- Trend based indicator used in identifying trends in chart analysis
- Filters noise by ignoring small market Swings and hence gives smother signals
Disadvantages of Zig Zag Indicator
- Inability to speculate or predict future price trends.
- The Zig Zag line cannot be predicted hence there are inconsistencies in its build-up of the required waves.
Conclusion
Zig Zag Indicator is a trend-based indicator used in identifying trends in chart analysis though lacks speculative or predictive ability Known for its ability to filter noise in the market by ignoring small market Swings and hence gives smother signals. Its swing points either are potential Resistance and Support levels which are veritable trade position areas in taking orders. This also helps in identifying entry and exit points in a given trade setup.
Thank you @kouba for the lessons.
I have used the tradingview site for all images/screenshots uploaded here.