Crypto Academy Week 16 | Homework Post for @fendit | The Wyckoff Method
Hi people of Steemit, I am glad to be attending lectures presented by Prof @fendit on Wyckoff Method. This method was well understood and worthy of participation.
Share your understanding on "Composite Man" and the fundamental laws. Whats your point of view on them?
The Wyckoff method came into emergence in 1920's and some of the online publication said 1930's but it was technical indicator that has since been used by traders/investors. It was first seen to be used in the stock market and later used in all financial markets. The Wyckoff method specifically helps in the detection of price behavior vis-a-vis volume in the trade. The different market cycles and phases are seen to be captured in this technical analysis which include the Accumulation, uptrend, distribution and Downtrend. Some the theories and techniques used by Wyckoff method is the Composite and Fundamental laws which would be discussed in the course of this post.

THE COMPOSITE MAN
This is one of the Wyckoff's concept and technical analysis that positions the investor to see the market as an individual entity rather than a larger market controlled by several investors. These individuals and single entities are called the composite man which happens to be the key players in the market. These are wealthy individuals or probably institutions with heavy cash flow who's activities are to profiteer from the different market cycles as captured by the Wyckoff concept.
The activities of the composite man is to predict the activities that affect market prices vis-a-vis the trading volume of different market trends at a given time. The activity(s) of the composite man may be seen to start from the different market phases which include the following;
Accumulation Phase
Uptrend phase
Distribution phase &
downtrend phase
In some cases we may have activities that requires a mini and temporary build up of the Re-accumulation and Re-distribution before attending either a full uptrend or full downtrend position.ACCUMULATION: This is the first entry position seen in the market cycle with heavy presence of the composite man who gradually makes his entry positions and acquisition of assets which sees a sideways trend. The accumulation of this assets are done in a way which drives a sideways trend in the this phase. But an accumulation of this assets at this phase would see a build of volume and hence tendency of an upward movement. This may likely be achieved because of Demand exceeding supply in the market.
UPTREND: This is the resultant effect of the composite man's activities in the accumulation phase where alot of assets are seen to be acquired. Due to the effect of Demand > Supply, prices of assets are seen to go up and hence the uptrend or mack-up movement seen in this second stage of the market cycle. During this uptrend movement, investors are also seen to make entry position into the market which further pushes up the trend to a more bullish positions given to the fewer supply and much demand created already. Let's remember that the Composite man at this point is HODLING after a huge accumulation made earlier which further drives scarcity of product that leads to price hike, uptrend movement and more volume traded in the market.
Moreso, this uptrend movement is a veritable positions to make profits for all investors who made an earlier entry into the market. Depending on the market trend, there are cases of a second accumulation during this uptrend also known as re-accumulation. This means Investors are seen to to still acquire and accumulate more of this assets which in most times we see a sideways trend along the uptrend movement.DISTRIBUTION: This is another similar scenario to the accumulation phase with sideways movement but in this case the Composite man is seen to sell-off or make gradual positions unlike what is seen in the accumulation. This phase happens to be the peak of the uptrend and a very high potential spot to make profits by the investor. There are also activities of late investors who come in to make entry positions with prospects of a more potential bullish trend. This sees a gradual sell-offs of asset by the composite man which at a time, Supply exceeds Demand and price begin to drop. And when this happens, there is likelihood of a downtrend in the market.
DOWNTREND: This is the inevitable and resultant effect of the activities seen in the distribution phase by the Composite man. At this point of downtrend, it is obvious there is drop in the price of the asset and Supply is seen to greater than Demand. Just like the scenario we have during the uptrend, there are possible occurrence of a re-distribution for a while which also corrects itself and follows a downtrend.
FUNDAMENTAL LAWS
The fundamental Laws are existing laws which form basis for other analysis and methodology to make an informed decision and resulted oriented outcomes while carrying out its experiments. The Wyckoff's method and concept, he laid emphasis on three basic fundamental laws which has further strengthened the use of its technical analysis. these laws include;
Law of Demand and Supply
Law of Cause and Effect
Law of Effort and Result
The Law of Demand and supply:
This may be simply classified mathematically in this form When:
a. Demand > Supply = Prices go up
b. Demand < Supply = Prices go down
c. Demand = Supply = Prices remain relatively stable without much of market volatility.
In the application of the Wyckoff's Concept, the activities seen in the accumulation when assets are gradually acquired which in-turn sees a an increase of volume and supply shrinking hence making demand >supply. This sees to the birth of the Uptrend seen in the stage two of the market cycle where a bullish trend is witnessed. This is also the reverse for the distribution zone where supply is seen to be greater than the demand and hence a drop in asset price and bearish trend. Having known this, investors specifically work with price action activities vis-a-vis volume traded at a given time to determine the demand and supply movements.
The Law of Cause and Effect:
This clearly states the actions and movements seen in the demand and supply of an asset is not just all about a random effect impact but a function of an event occurrence. This is to say that, an event (CAUSE) in point A would definitely give a reaction (EFFECT) in point B. This is not coincidence or random/probability effects but a previous resultant effect and occurrence in the market activities. I will also apply this Law in the Wyckoff's concept where he highlighted 4 major points in the market cycle. The Composite Man's activities in the accumulation cycle is the CAUSE of why the Uptrend is seen which is the EFFECT. Also is the Composite man's CAUSE activities in the Distribution which sees the EFFECT of a Downtrend in the cycle.The Law of Effort and Result:
The changes in an asset's price is the effort which is seen in the trading volume at that given time. If the price action of a given asset is seen to be in a stable state with the trading volume, this simply means that the Effort = Result and there are very low market volatility. When there larger amount of assets exchange hands in the trade, this simply means there would be an increase in the Volume of the assets (Effect). Hence this would bring about a spike in the price of this assets (RESULT).
Share a chart of any cryptocurrency of your choice (BTC or ETH won't be taken into account for this work) and analyze it by applying this method. Show clearly the different phases, how the volume changes and give detail of what you're seeing.
The screenshot above is a practical demonstration of the Wyckoff's concept which also represents a technical analysis used during trading. This screenshot was able to pick the complete market cycle which are represented in the accumulation, uptrend, distribution and downtrend movements. In this analysis, I used the CAKE/BND cryptocurrency pairs to demonstrate this technical analysis on a 6H timeline.
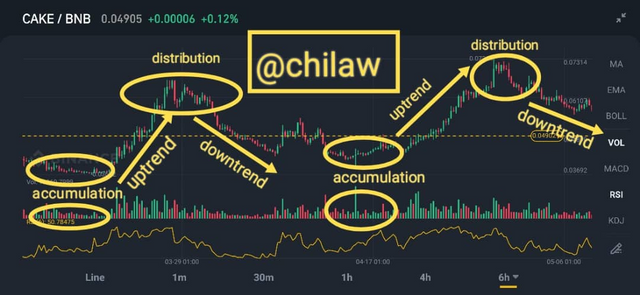
The Accumulation as well spelt out captures a sideways trend where we can see enough volume of activities happening though on a gradual level. In this place the composite man keeps acquiring more volume of assets and if this terrain continues, there would be a situation where supply will start shrinking and would no longer be enough to meet up with demands. In this case the price of the asset will start going up.
The Uptrend is seen from the effect of the activities in accumulation phase which gives a result known as the Uptrend. In this place more retail investors are also making entry positions and hence the price of this assets keeps soaring and becoming more bullish. For investors who make earlier entries are at a better chance to make profits from price changes. From the chart, we can see the long trend which demonstrates a more better position for profiteering. Trading volume is also seen to continue to increase as market continues the bullish trend.
The Distribution is also a similar scenario of what we have in the accumulation phase except in this time the composite market makes some gradual exit positions to make profits to those late investors who also make entry positions due to the bullish trend seen in the chart. The trade volume seems to remain in some form of less volatile trend due to the gradual sell-offs. We all know what happens when the composite man continues to make exit positions or sell-offs in the distribution stage. Supply will be greater than Demand and price would also drop.
The Downtrend is the result or effect of the activities in the distribution zone or overbought zone. At this point, volume is seen to reduce and asset price also drops hence the bearish trend witnessed. Trust the Composite man, this another oversold zone he will likely want to start accumulating this assets again given to the low prices.
Conclusion
The Wyckoff Concept and method is all encompassing one that practically guides the investor and trade the next line of price action vis-a-vis volume bars. This helps in price prediction and market trend at a given time if properly used as a technical analysis.
Thank you Prof @fendit, this is my submission.
Thank you for being part of my lecture and completing the task!
My comments:
Nicely done! Nice explanations and a very well presented work, I really appreciate it!
Overall score:
8/10