Crypto Academy / Season 3 / Week 8 - Homework Post for professor @cryptokraze | Trading Sharkfin Pattern
Hi friends, this is my entry for this weeks homework task.
What is your understanding of Sharkfin Patterns. Give Examples (Clear Charts Needed)
SHARKFIN PATTERN
Sharkfin patterns are simply trended patterns that show traders the strength of trends in a given direction or level before making a sharp reversal in the opposite direction which hence creates a V like shape or an inverted V like shape in the tread pattern. There are basic forces that determine the sharp trends of an asset that isn't far fetched from the buy and sell activities. In the concept of the composite man of ACCUMULATION & DISTRIBUTION, such levels of price rush could also create such sharp price reversals or continuity.
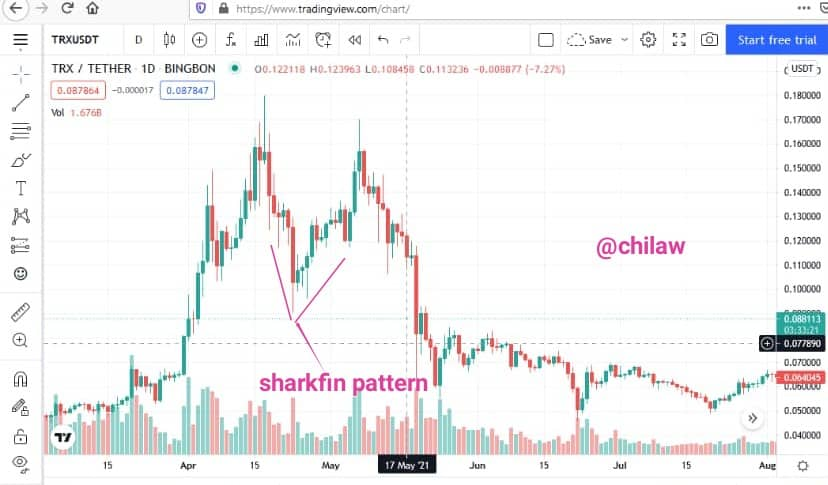
These various trend reversals are likely seen to occur in places with the resistance or supportive areas which means we may have the Sharkfin pattern either happening in the uptrend or downtrend positions. When we have a price trend moving in the uptrend position and later make a sharp reversal in the downtrend direction, the Sharkfin is seen to make an INVERTED V-SHAPE structure.

In another hand, when the price trend is making a bearish movement and quickly reverses itself in the opposite direction, the Sharkfin Pattern is seen to make a V-SHAPE structure.

Implement RSI indicator to spot sharkfin patterns. (Clear Charts Needed)
Sharkfin Pattern
The Sharkfin Pattern can be seen to work independently as a technical indicator as well as in combination with other indicators. It is a good trading move when we use additional indicators on prevailing indicators to take or make trading positions. The RSI when added to the Sharkfin pattern gives it an optimized trading option with its overbought levels and oversold levels of asset trends. In using the RSI, we have to set the length at 14 and the bands at 70 and 30 for overbought levels and Oversold levels respectively.
Downtrend Reversal while using RSI & Sharkfin
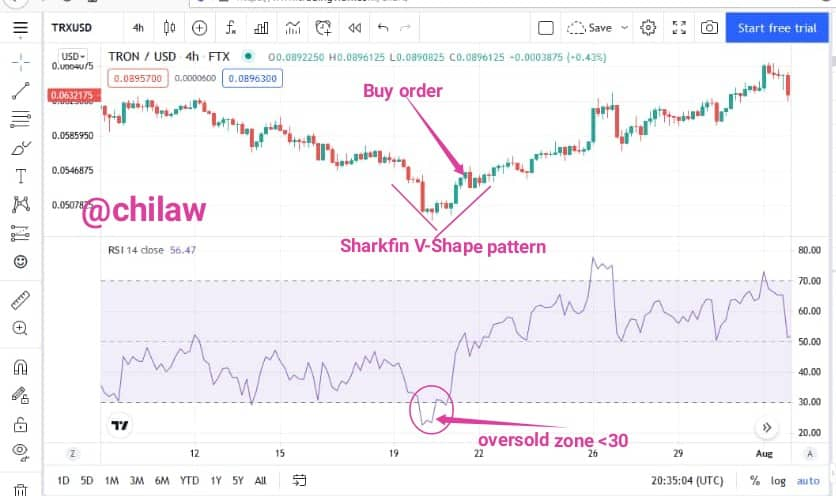
In the downtrend reversal scenario, the price trend is observed to be bearish and heading towards the Oversold levels. The price trend moves below band 30 and sharply makes a reversal above the same band and headed bullish. When this sharp reversal happens, it creates a V-shape like pattern which we call the Sharkfin pattern.

Uptrend Reversal while using RSI & Sharkfin
In the Uptrend reversal scenario, the price trend is observed to be Bullish and heading the Overbought levels. The price trend moves above the band 70 and sharply reverses in the opposite direction and follow a bearish trend therein. When such a sharp reversal happens, it creates an Inverted V-shape pattern which we call the Sharkfin pattern.

Write the trade entry and exit criteria to trade sharkfin pattern (Clear Charts Needed)
Trade Entry Criteria
Buy Position
- To start up this position, you need to add the RSI indicator using the default settings
- Price trend should be approaching the 30 RSI line on a bearish trend and hence crosses below the 30 RSI line which represents the oversold zone
- There is a quick trend reversal on the opposite position and hence crosses above the 30 RSI line and continue on a bullish trend. This forms a V-shape like structure known as the Sharkfin pattern
- A long bullish trend above the 30 RSI line represents a valid break and hence should take a buy position
Sell Position
- To start up this position, you need to add the RSI indicator using the default settings
- Price trend should be approaching the 70 RSI line on a bullish trend and hence crosses above the 70 RSI line which represents the overbought zone
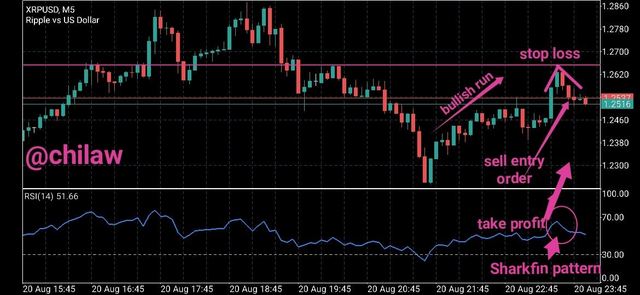
- There is a quick trend reversal on the opposite position and hence crosses below the 70 RSI line and continue on a bearish trend. This forms an inverted V-shape line structure known as the Sharkfin pattern.
- A long bearish trend below the 70 RSI line represents a valid break and hence should take a sell position

Exit Trade Criteria
Buy Position
- To start up this position, you need to add the RSI indicator using the default settings
- Introduce the Stop loss or take profit should in case of trade goes in either position to minimize losses as well maximize profits.
- Stop-loss should be introduced below or just at the last swing low point where the Sharkfin pattern occurred
- Take profit should be introduced above the market price or trade entry buy level at a 1:1 RR

Sell Position
- To start up this position, you need to add the RSI indicator using the default settings
- Introduce the Stop loss or take profit should in case of trade goes in either position to minimize losses as well maximize profits.
- Stop-loss should be introduced above or just at the last swing high point where the Sharkfin pattern occurred
- Take profit should be introduced below the market price or trade entry sell level at a 1:1 RR

Place at least 2 trades based on sharkfin pattern strategy (Need to place trades in demo account along with Clear Charts)
- XRPUSD Chart: 5M Time Frame

- LTCUSD chart for 5M time frame

- DSHUSD Chart for 5M time frame

In the above chat for XRPUSD, LTCUSD & DSHUSD, we can see a trend on the bullish run and get to the overbought zone. The Overbought zone just as we explained is at band 70 for the RSI indicator. There was a quick reversal that happened in the opposite direction and hence bearish. We can see the take trade point where a valid bearish trend is observed.
Thank you, Prof, this is my entry for your homework