Puria Method Indicative Strategy- Steemit Crypto Academy- S5W4-Homework post for @utsavsaxena11

Hi guys!
You are welcome to my homework task given by professor @utsavsaxena11 for the week’s lesson. I will be explaining the Puria method of indicative strategy with screenshots to help make better descriptions. After this I will make a trading strategy of my own that will utilize knowledge from the lesson and addition trading knowledge in order to put out a good strategy of my own. This I will do in the form of a series of questions and answers.

QUESTION 1:
Explain Puria method indicative strategy, what are its main settings. which timeframe is best to setup this trade and why? (Screenshot needed and try to explain in detail)
The Puria method indicative strategy is a trend based strategy that became famous in early last decade. This strategy utilizes indicators to filter noise and avoid wrong interpretation that comes from noise. This trading strategy has been tested and proven effective by different traders before it experienced a boom in its use by traders. This trading strategy is quite simple and non complicated. Most efficient for intraday traders as they use it on different timeframes mostly ranging from 5mins to 300mins. To make this strategy an easy one, you can still apply the triangle, rectangle or any other price trend strategy to add further significance to the information the Puria strategy will give you.
The best timeframe I can advice an intraday trader to usebfor this strategy is between 5min to 30min timeframe so that you can have your trade executed in a shorter time. All indicators shall be set in the same timeframe as the chart timeframe you are trading on. This strategy utilizes two Moving Averages (WMA) and the Moving Avertage Convergence and Divergence (MACD). The two moving averages are used as support and resistance lines when price trades below and above them respectively. The MACD is the indicator that is utilized in this strategy to filter noise by avoiding false trend signals from the moveing average lines.
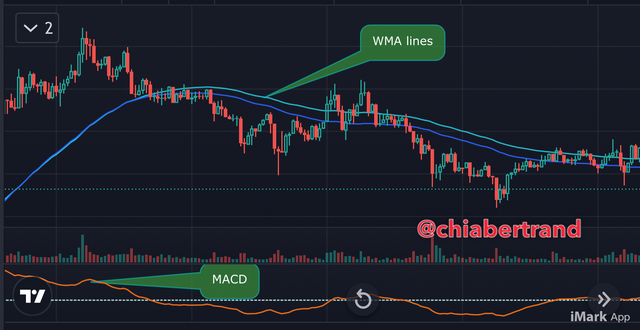
XRP/USDT pair Source
The screenshot above shows a complete set up of the Puria trading strategy on XRP/USDT pair. We can see the two WMA lines and how the price will trade belo and above them with time. The MACD is seen belo on the screenshot above. The MACD moves above and below the zero line where entry signals are taken. With all requirements met, indicators properly set, the Puria strategy can make enormous intraday trading profits.
The various settings applicable on the Puria strategy are described below.
CHART TIMEFRAME
The first thing to do is to know the chart timeframe you want to trade on. This is the timeframe to which all the indicators shall be set on. For intraday trading based on this strategy it’s advisable to use periods within the range of 5mins to 30mins price chart. That is for my opinion. This is so that the position size can be executed in a shorter period of time.
MOVING AVERAGE WEIGHTED
The WMA is set depending on the trader and the timeframe to which the trader is interested to trade on. Firstly, the two WMA are set one after the other maintains the same time as the price chart.
The first WMA is set up using a 75-period length and the source placed at “LOW”. This set up can be seen on the screenshot below. I’ve made sure I’m not using green or red color fir my indicator line in order to avoid confusion with the candlesticks.
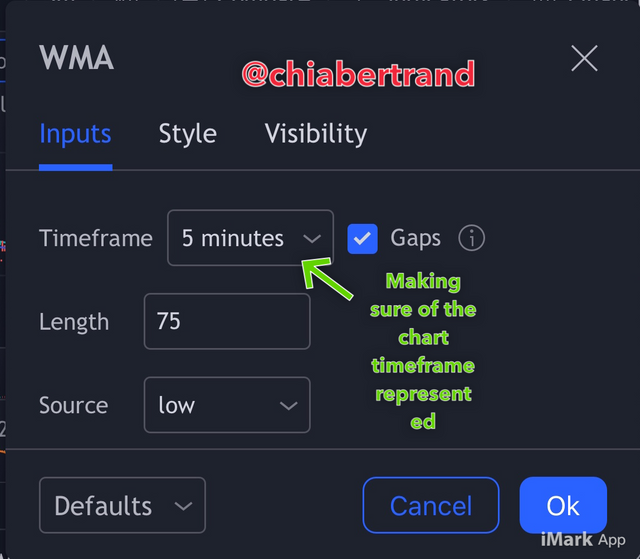
Source
The second WMA is set up using 85-period length and the source placed at “CLOSED”. Th timeframe set to 5mins the same as the price chart. The screenshot below best describes this setting.
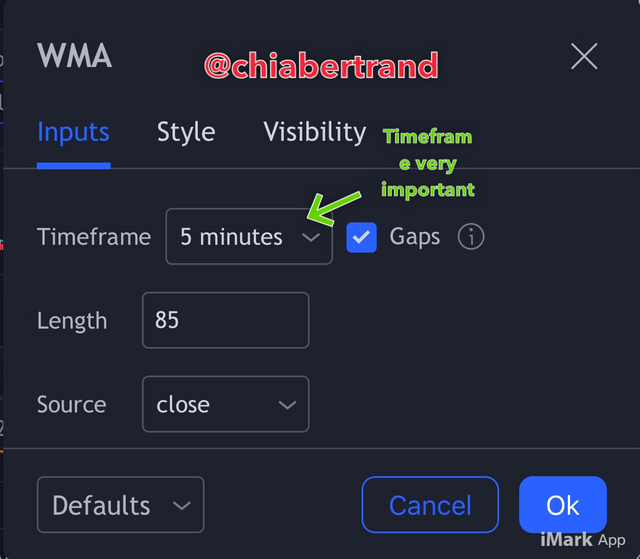
Source
As seen from the above screenshots, the WMAs are required to set up like I did. That is, one WMA at 75-period length and the other at 85-period length with sources at “LOW” and “CLOSED” respectively.
MOVING AVERAGE CONVERGENCE DIVERGENCE
The MACD is set up in a particular way like the previous two WMAs. Here three things will be configured for this strategy. Firstly, the fast length will be changed from the default setting to 15 while the slow length will be kept at 26. The third thing to do is to change the signal smoothing from 9 to 1. Now we ca only see the zero line clearly with the MACD oscillator line. Any color can be chosen since it won’t be linked to the price chart.
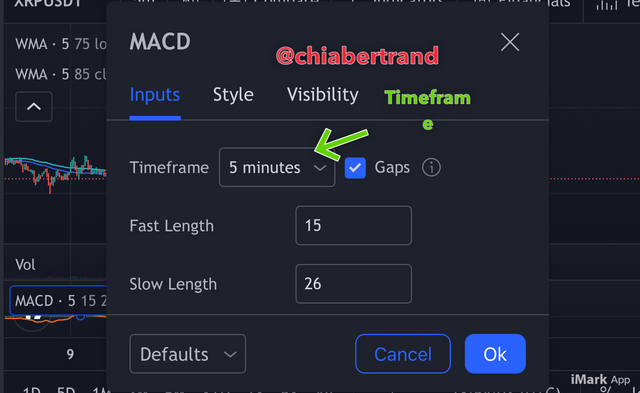
Source
The screenshot above shows the MACD set up. With all these done, we have a full Puria trading strategy.
QUESTION 2:
How to identify trends in the market using the puria method. Is it possible to identify trend reversal in the market by using this strategy? Give examples to support your article and explain them. (screenshot needed)
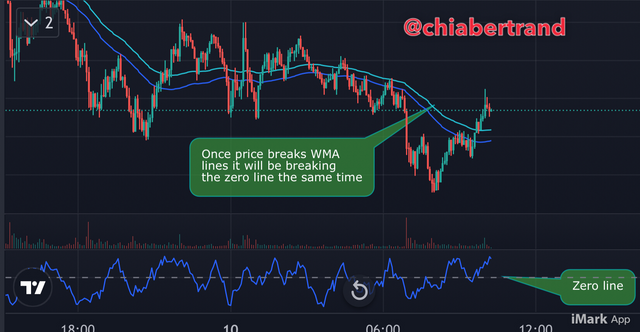
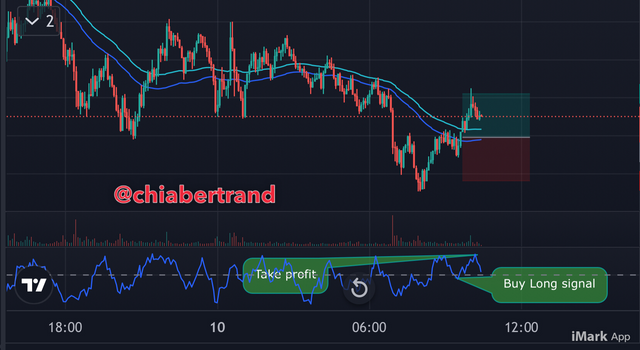
The Puria strategy makes use if both trend and the MACD indicator for filtering noise. This strategy can be used for trend identification since the two WMAs used are acting as resistance and support on price movement. If the price is trading below the two WMA lines then the market is in a bearish trend and if the price trades above the two WMA lines, the price is trading in a bullish market. To take a compliment, when the MACD is below the zero level we have a bearish trend and when above the zero elect we have a bullish market. Combining the trend i identification using both MACD and WMA we produce good trend analysis.
It’s is very much possible to use the Puria strategy to identify trend reversals
HOW TO IDENTIFY TRENDS
To identify trends using the Puria strategy is very simple. Taking the WMA lines as the resistance and support of the price movement, one can easily detect a trend reversal using this strategy. Once the price hits any of the WMA lines and is rejected back we consider that as a pullback hence leading to the already existing trend. This can occur in both bullish and bearish markets.
For a trend reversal, the price will be seen breaking the two WMA lines on the chart meaning the price movement is changing from one market structure to the other. This is first confirmed by the MACD whereby it reaches the the zero line and crosses to the other side for which case we have a trend reversal but if rejected at the zero line it’s just a trend pullback. This can be supported by different trend reversal strategies when they occur alongside these activities. Below is a screenshot showing the above mention situation of both reversal and pullback when price is rejected from making a reversal.
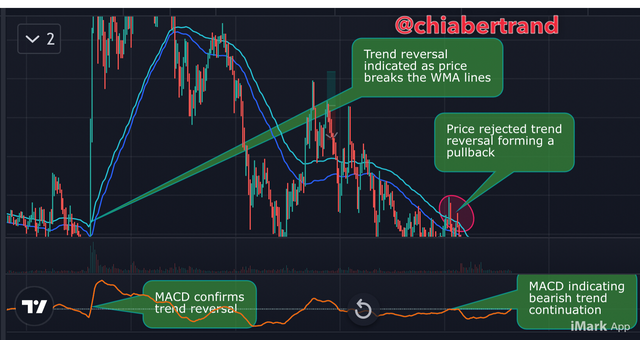
XRP/USDT pair Source
QUESTION 3:
In the puria strategy, we are using MACD as a signal filter, By confirming signals from it we enter the market. Can we use a signal filter other than MACD in the market for this strategy? Choose one filter(any Indicator having 0 levels) and Identify the trades in the market. (Screenshot needed).
Aside the MACD indicator for signal filtering we can still use other indicators such as the momentum oscillator set at 20 for the lower level and 80 for the upper level. Once prices cross the zero line into the 80 level section we have a bullish market whereas if this happens to the 20 level section we have a bearish market. With the Momentum oscillator the noise from the WMAs can be filtered and good entry points made.
**ETH/USDT pair **Source
To identify entry or exit points using the momentum oscillator as a filter indicator for the Puria strategy is very simple just like with the MACD indicator. The following screenshot describes how I made use of the Momentum Oscillator to identify trades using the Puria strategy. This was done with a 1:1 risk ratio.
ETH/USDT pair Source
QUESTION 4:
Set up 10 demo Trades (5 buying and 5 selling ) on 5 cryptocurrency pairs using puria method indicative strategy. Explain any 2 of them in detail. Prepare a final observation table having all your P/L records in these 5 trades.
I placed five selling trades and five buying trades for different cryptocurrencies. The five sell trades went 100% successful and so did the buy trades on the other hand. This shows how good this strategy is. Below are screenshots of the different trading pairs and my set up using the Puria strategy. After the screenshots follows a table of the buy/sell entries and profits/losses.
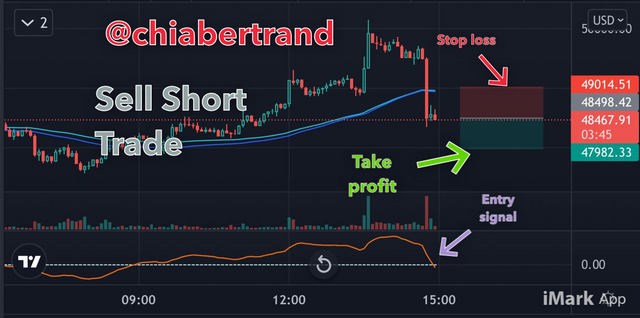
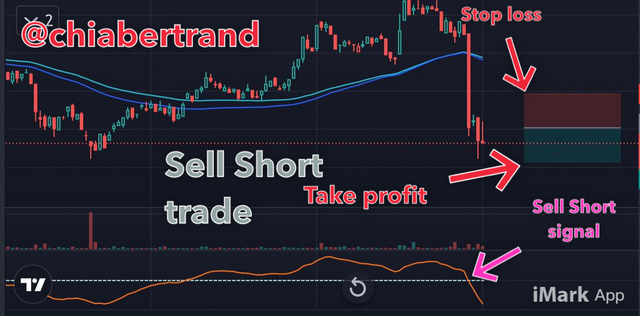
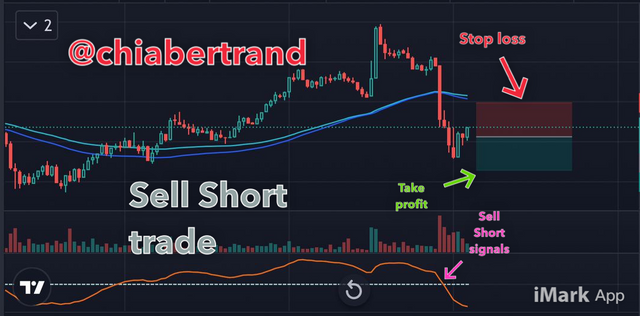
Sell Short trade of BTC/USD pair Source
This trade was set with entry at 48498.42USD/BTC and I set the stop loss at 49014.5USD/BTC while the take profit was set at 47982USD/BTC. This entry was made after I noticed that BTC/USD pair is trading below the WMAs and the MACD just passed the zero level heading downward. After confirming from two candlestick forming beneath the WMAs, I made this entry. This trade made me a profit of 419.05USD. The timeframe was set at 5mins for both the chart and indicators.
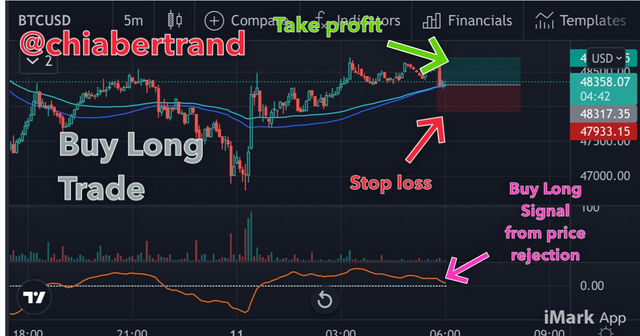
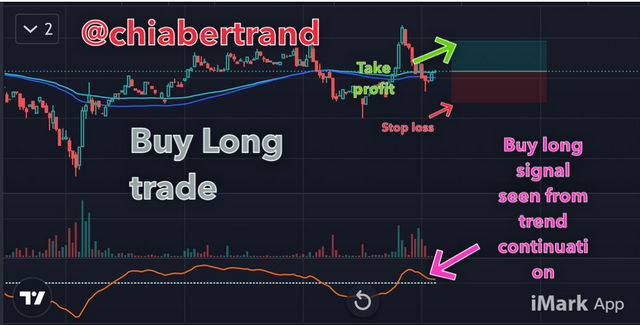
Buy Long trade of BTC/USD pair Source
Sell Short trade of ETH/USD pair Source
Buy Long trade of ETH/USD pair Source
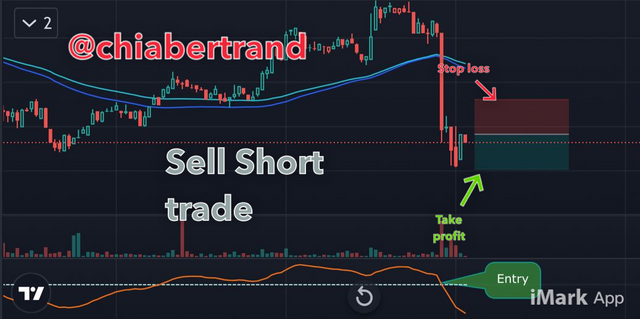
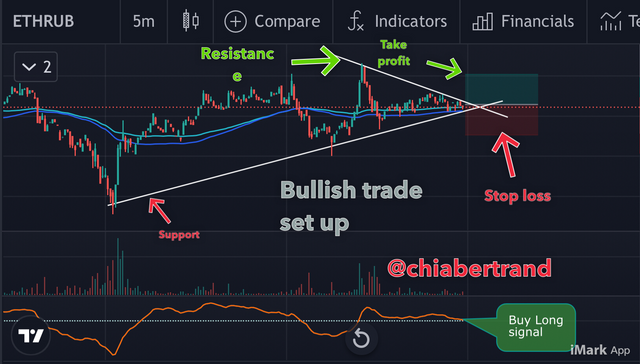
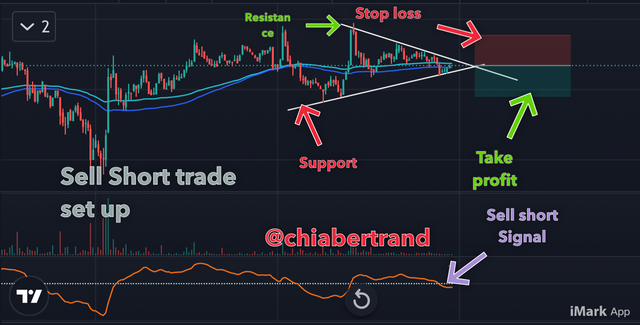
Sell Short trade of ETH/RUB pair Source
 )
)
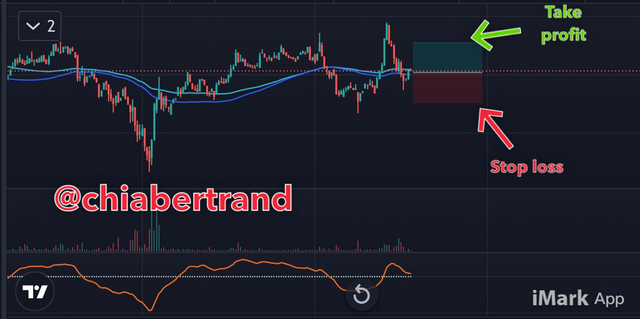
Buy Long trade of ETH/RUB pair Source
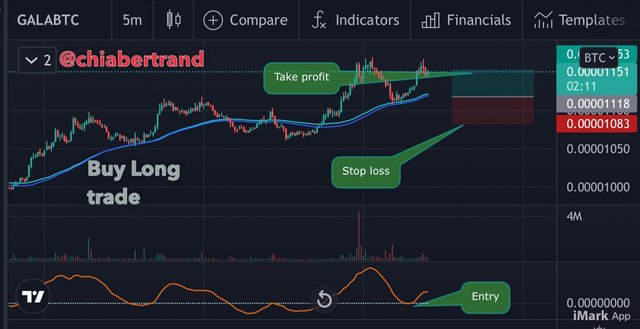
Buy Long trade of GALA/BTC pairSource
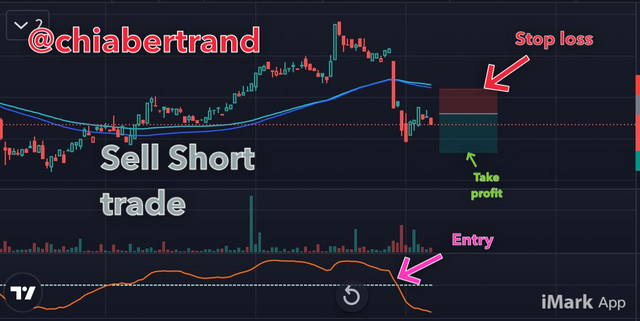
Sell Short trade of LTC/USD pair Source
Sell Short trade of LTC/RUB pair Source
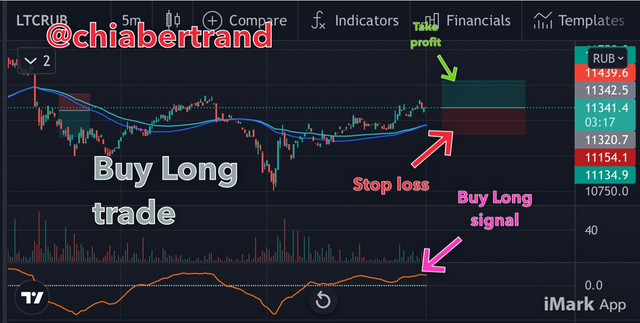
Buy Long trade of LTC/RUB pair Source
The next pair i will like to explain after the BTC/USD Sell Short trade is the LTC/RUB Buy Long trade. This entry was made at 11342.5RUB/LTC and this execution was influenced by price maintenance on the uptrend above the WMAs and also the movement of MACD above the zero level. The risk reward ratio wasn’t set to 1:1. Stop loss at 11154.1 while the take profit at 11529.3. Unfortunately I couldn’t launch this trade on my MT5 mobile App because trades weren’t launching for a very long time.
The screenshots below show’s the trade progress for those trades I was able to launch and the last screenshot is the final completion of the trades. All trades launched went 100% successful. As can be seen on the screenshot below my total profits for the five launched trades was 534.68$. The screenshot below show’s trading results of all Sell Short demo trades.
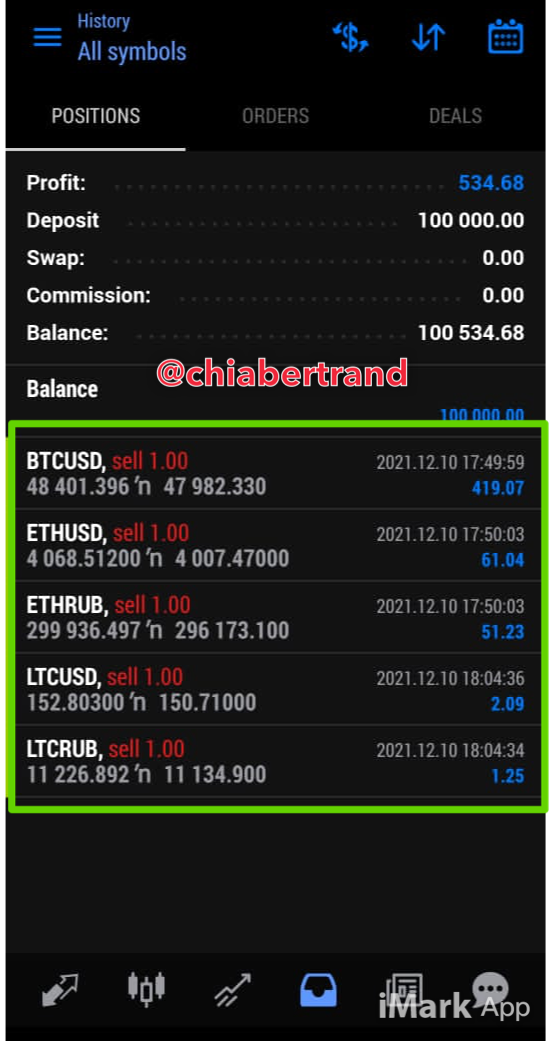
Image from MT5 mobile App
TRADE RESULTS TABLE
| S/N | Pair | Buying price | Selling price | Profit | Loss | Timeframe |
|---|---|---|---|---|---|---|
| 1 | BTC/USD | - | 48498.42 | 419.07 | - | 5mins |
| 2 | BTC/USD | 48317.35 | - | - | - | 5mins |
| 3 | ETH/USD | - | 4051.98 | 61.04 | - | 5mins |
| 4 | ETH/USDT | 4006.63 | - | - | - | 5mins |
| 5 | ETH/RUB | - | 299303.8 | 51.23 | - | 5mins |
| 6 | ETH/RUB | 295826.6 | - | - | - | 5mins |
| 7 | LTC/USD | - | 152.82 | 2.09 | - | 5mins |
| 8 | GALA/BTC | 0.00001118 | - | - | - | 5mins |
| 9 | LTC/RUB | - | 11320.7 | 1.25 | - | 5mins |
| 10 | LTC/RUB | 11342.5 | - | - | - | 5mins |
I did all the above trade services up as can be seen from the 10 screenshots above, but when about to lunch the trades for the bullish market my MT5 mobile App couldn’t run them. I tried for hours to no avail. That’s why we can see only feedbacks from the sell trades which all was a success.
QUESTION 5:
You have to make a strategy of your own, it could be pattern-based or indicator-based. Please note that the strategy you make must use the above information. Explain full strategy including a time frame, settings, entry exit levels, risk managment and place two demo trades, one for buying and the other for selling.
The strategy I want to make is that of the triangle pattern strategy. I will employ the MACD as filter to false breakouts. The triangle pattern alongside the MACD will give additional confirmation points to identify both trends, price breakouts and entry and exit confirmation points. Everything will be set on intraday timeframe which to me I can only take between 5mins and 30mins in order to execute a trade quickly. Therefore I will make use of the two WMAs and a triangle or rectangle set up for pattern identification while the momentum oscillator will give me “Buy Long” and “Sell Short” signals.
TRADE SET UP
With the above indicators and trend identifiers put in place, we have my strategy set up already made completely. For the triangle patterns, I will just give a brief explanation of their set up.
When price trades and forms a triangle, a resistance line is drawn joining the top prices as they make a decline and another for the bottom as they make an ascend. The later being the support line. Triangles can be bullish, bearish or asymmetrical but I will not go into the details of that. Once there’s a trend breakout from the triangle and confirmed with the WMAs for the new trend or trend continuation. The momentum oscillator will signal the entry.
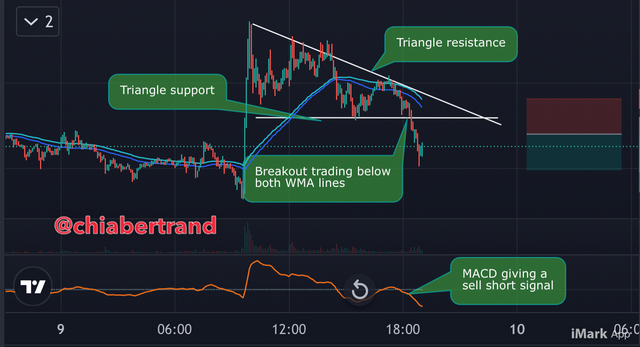
XRP/USDT pair Source
ENTRY AND EXIT
My entry and exit game of this strategy is marked when I identify price breakouts and confirm with my filter indicator.
For entry I take the point of break on a triangle as my entry point and set a 1:1 risk ratio for stop loss and take profit. The additional risk management I practice is by making sure within my take profit range I break it into two and 50% take profit at the center and the last 50% at the target on chart. This way I minimize risk and maximize profit. The screenshot below can tell us more about this process which shows a complete set up of my strategy until take profit levels.
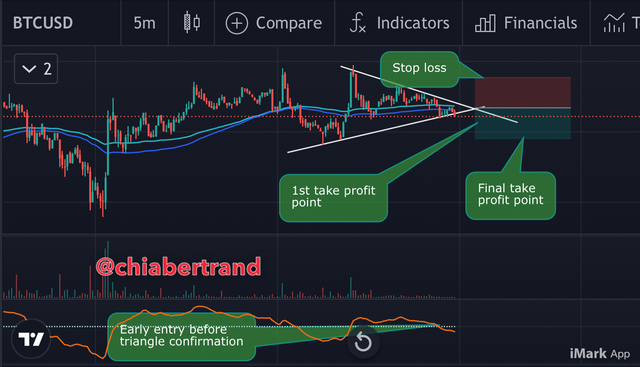
BTC/USD pair Source
BULLISH AND BEARISH DEMO TRADES OF MY STRATEGY
The screenshots below will identify or describe how I set up my trades using the strategy I just described above. The bullish and bearish trades have been put together in different screenshots below.
ETH/RUB pair Source
BTC/USD pair Source
I actually did a demo trade iDVD the above set up but my MT5 App couldn’t lunch a trade since morning of today.
We have come to the end of my homework task. I have Explain completely the Puria trading strategy and proposing an additional set up with credits this strategy. With my new set up I have made a take profit system whereby one can use and minimize losses while maximizing profits when carrying out intraday tradings. Hopefully someone learned something from my homework post. We meet again next week for my homework tasks.
Thanks for reading
Steem on!
Jesus loves you
IT SHOULD BE NOTED THAT ALL SCREENSHOTS WERE GOTTEN FROM www.tradingview.com and MT5 MOBILE App by @chiabertrand UNLESS OTHERWISE STATED ABOVE