Crypto Trading With Linear Regression Indicator]- Crypto Academy /S5W5-Homework Post for kouba01


1. Discuss your understanding of the principle of linear regression and its use as a trading indicator and show how it is calculated?
Before talking about Linear Regression in crypto trading, it's good we have a general understanding about it.
In science, we should know that Linear Regression is an anticipatory process that provides a Linear relationship between the augury(let's say Y) and that of the input (let's say X) and it usually represent a straight Linear line on the graph Or in simpler term, it is the regression model which gives an estimate relationship that exist between two quantitative variables[ one variable is independent (Y) and one other variable which is dependent (X)] which are plotted on a straight line.
Let's get deep to this by taking a real life explain. Let's say in an industry, the price of the goods produce is usually very lower than the price of the same goods when taken out of the industry. So we see how the price will be varying from one town to another dependent on the distance traveled. So we also see that the price of the goods are usually very low if bought directly then high depending on the distance traveled before selling the goods. But it's clear that we can never get a perfect relationship between this goods and it's prices per distance traveled unless we use a machine to determine it

Looking at the chart above, we can see that "A" has a small number equivalent to 20 but as the chart keeps moving, it becomes Wilder and point "C" have a Larger number which is equivalent to "40". We can see that there is a linear relationship between "X" and "Y"
Linear Regression and Crypto Trading
In statistics, we saw that Linear Regression is the is use to calculate two separate variables such as "X" and "Y" in other to define a linear relationship but in crypto trading, linear regression is usually use to analyze two separate variables ( price of an asset against time) in other define a single relationship. Hence, both quantitative and technical analysis are usually Carried out by traders Inorder to determine the prices of assets moving horizontally on a chart either uptrend or downtrend at different time frames with the help of This linear regression method, they may spend minutes, hours, days, weeks or even months before finally coming out with results and that results can be successful as well as not successful depending on how far the traders can be able to use the indicator and predict the prices of assets.
However, with the use of this linear regression tool, it will be very difficult for good traders to come out with unsuccessful results. But using this indicator, traders could be be able to identify all key price point, entry point, takeprofit point, stop loss point and then exit points.
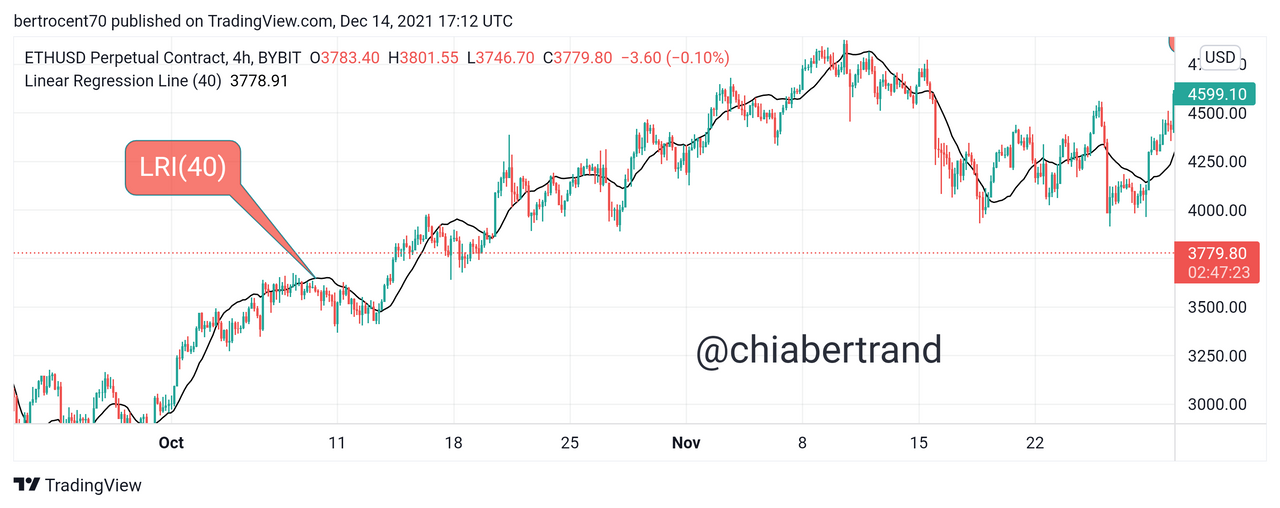
That is a chart of ETHUSD which a "Linear Regression indicator" have been added to it. We can use the indicator to examine and predict the price of the asset at any time interval by using either opening or closing price of the asset between candles. While on the chart, we can choose different points and then use different candles in other to calculate our linear regression by using any number of period but as from 14 periods upward in order to have accurate results
So we see that an asset price together with it's time frame could be determined by bringing out the variables from the linear regression which is highly applicable
How to calculate Linear Regression
Calculations using this indicator is quite simple because it has a general formula which is Y = a + bX. I will be explaining this in general below
Y = a + bX
Where,
a is the intercept
b is the slop of the line
X is the variable
Henc,
a= [[{y-(x)}]]÷n
and
b = [[ n{xy} - {(×){(t) ÷ {n(x²- {(x}²]]
Where,
n is the the number of periods selected
x is the current periodic time
y is the referred to as the closing asset price
Uses Of Linear Regression
With the help of Linear Regression, traders can be able to determine an know th effects of variables in the market
As I earlier mentioned that in statistics, there variables such as X and Y, and in crypto trading, instead of X and Y, we variables such as price of assets and the time period. So this linear regression enables traders to be able to determine this variables and gives out good results which trends can predicted.
2. Show how to add the indicator to the graph, How to configure the linear regression indicator and is it advisable to change its default settings? (Screenshot required)

How To Add Linear Regression indicator to the Graph
In other to perform this task, we have to first of all Log in to the official site of tradingview.com
Step1
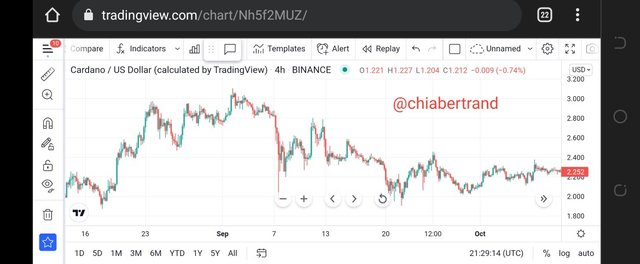
Here is chart which consist of a pair of ADAUSD
Step2
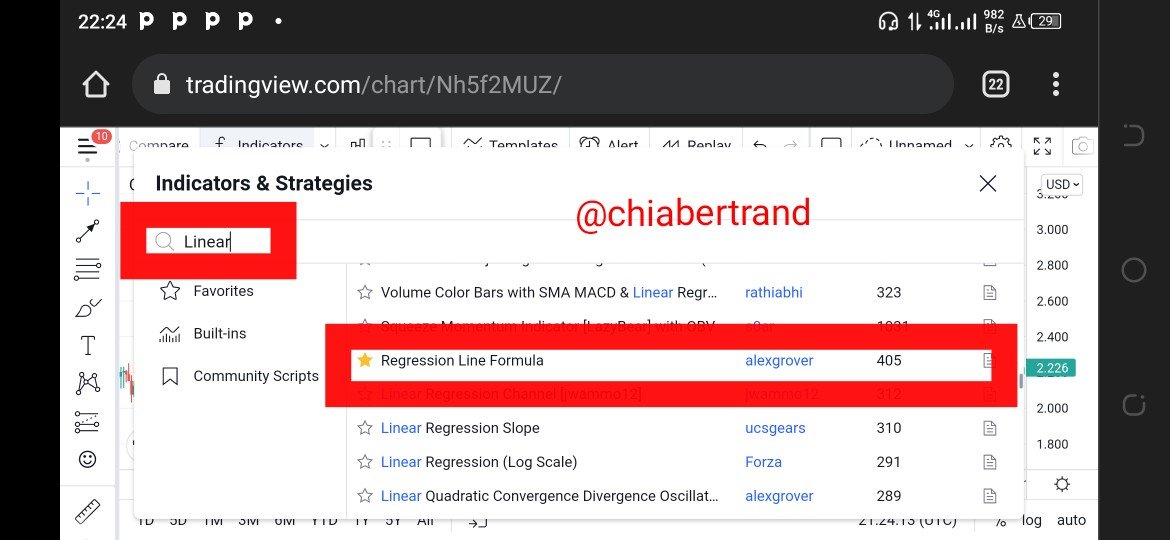
I now navigate to the top of my chart and click on the fx button

Step3
I now type Linear regression in the search box and choose Regression Line Formula and then click on it. After clicking on the indicator, I now go back to my chart
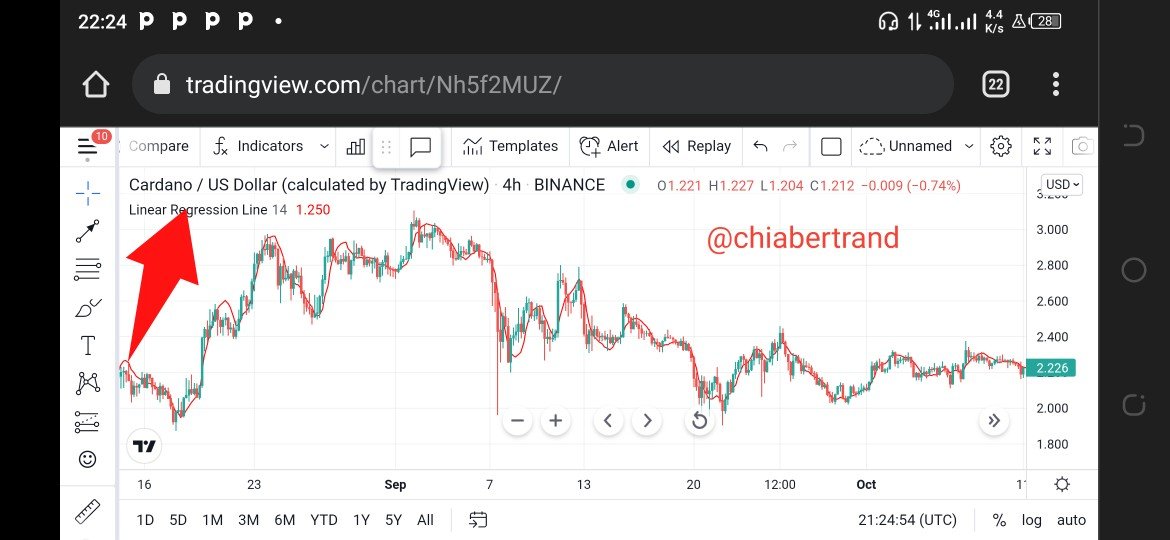
The indicator have successfully been added to the chart
How to configure the linear regression indicator
Step1
I will have to click on the custom window of the indicator then when it appears, I now click on setting as shown below

Step2: Input
The input has a default value of 14 period. But since according to Meyers and Colby, this Indicator can get a good results at the value of 66 periods, I now changed it to 66periods as seen below

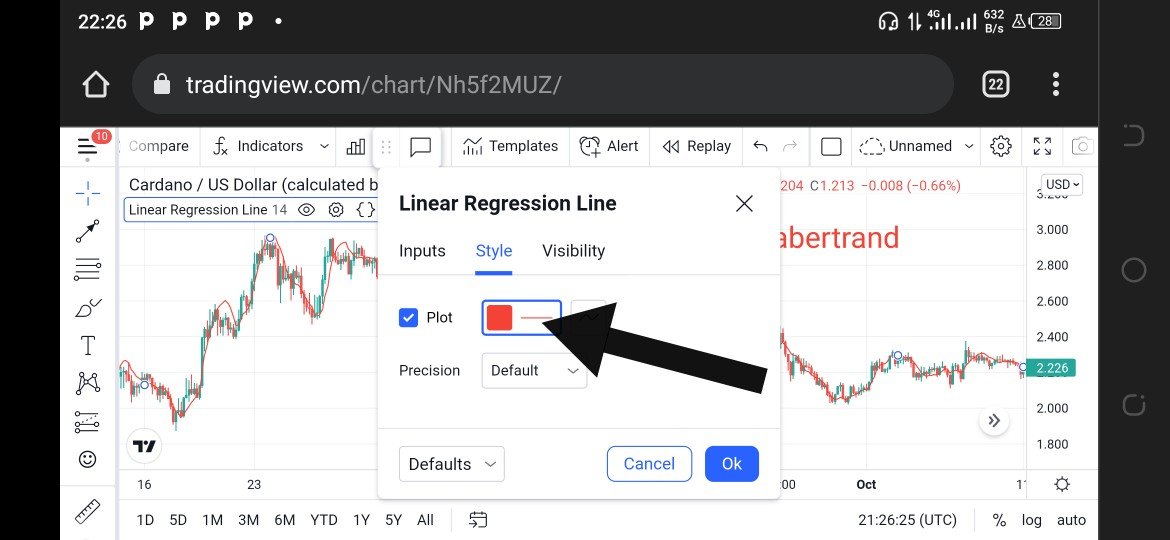
Step3 Style
My font color here was initially thick red, but I configure it and changed it to thick black as seen below


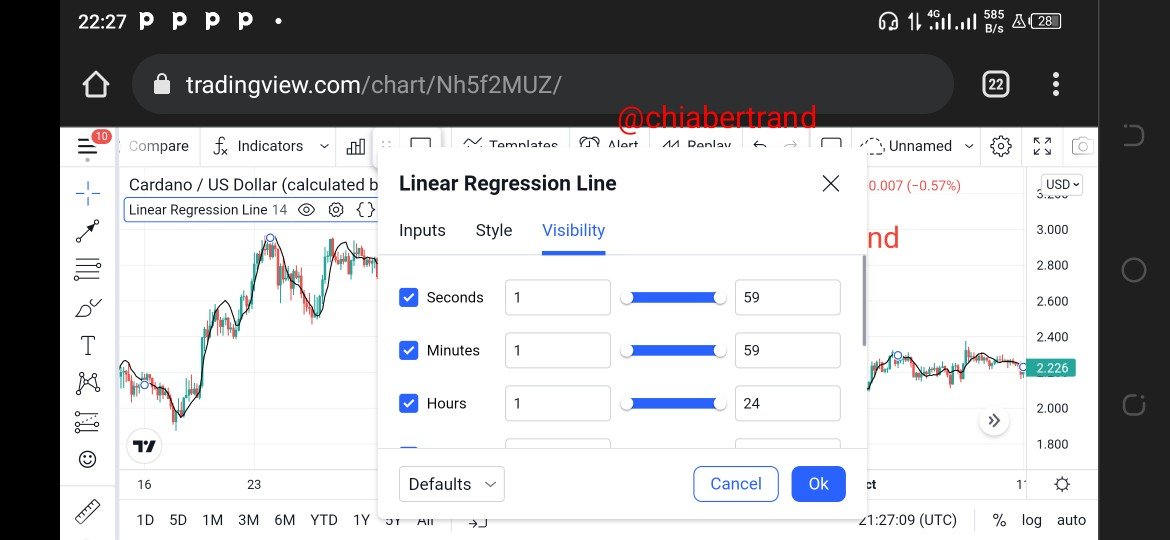
Step4: Visibility
I allow all the visibility setting to it's default settings
Now going back to my chart, I see that I have successfully configure it to my taste as seen below

Is it advisable to change its default settings?
I will be answering this question using the graphs below as my back up
Before answering this question, we should know that the linear regression indicator work best as 66 periods but it works good at other periods depending on the commodity and the timeframe as well as it could still work very well at its default settings but there maybe a delayance of signals hence giving it false signals. So for me, changing it's default settings is good because it will give a more price reading. It will also work best when combined with other indicators


Looking at the chart above, we see that it has different periods, it's fault period of 14 and another chart with a period of 66. Now looking at the selling signals, we that the chart with a linear regression indicator having a period of 66 gives an accurate and precise prediction of selling signals than the chart with a default setting of 14 period which gives a delay in selling signals.
So for me, it's good to change it's default settings especially if you are good in trading, but I will advise new traders to always use it's default settings in other to avoid avoid excess losses when it's default setting is changed to a period which is not good for the market at that particular moment because this default settings is good for both beginners and ancient since it can be use to generally give prediction to prices of an asset in the market
3. How does this indicator allow us to highlight the direction of a trend and identify any signs of a change in the trend itself? (Screenshot required)
In other to highlight the directional trend and also identify signals of the changes in trends using the the linear regression indicator is somehow very easy and I will be explaining it below
We should know first that this linear regression indicator line move on the chart following the asset price and time so as to determine the next direction of the asset price. So we see that this LRI lines is generally use to identify the trend direction so that traders could determine wether the trend is bullish or bearish because this indicator moves in thesame direction of the trend and when ever the LRI lines move up or down following the trend, traders could use it to determine if there is a new trend which could be bullish or bearish
For Bullish identification, the LRI line usually moves slightly below the asset price in an uptrend direction
On the other hand, for Bearish identification, the LRI line usually moves slightly above the asset price in a downtrend direction
This can be identified in the chart below


Using LRI to Identify Trend Reversal
Knowing how to identify both bullish and bearish movement using this indicator as stated above, we can now be able to identify it's Trend Reversal using this indicator and we can identify it by simply looking at the regression line if it slopes then the asset price crosses the linear regression line. When this asset prices crosses this LRI line, it will either change the direction of the LRI line to be bullish or bearish
For a bullish reversal, the LRI line will slop and then start moving from a downtrend to an uptrend
On the other hand, For a Bearish reversal, the LRI line will slop and then start moving from a uptrend to downtrend
This demonstrate can be seen on the chart below


4. Based on the use of price crossing strategy with the indicator, how can one predict whether the trend will be bullish or bearish (screenshot required)
Using this indicator to predict whether a trend will be bullish or bearish is very simple. When ever the price of the asset together with that regression line touches each other, we can determine at that particular point if the trend is bullish or bearish
For a bullish trend, both the price of the asset(the candle) and the regression line will cross each other high while for a bearish trend to be determined, both the price of the asset(the candle) and the regression line will cross each other low. At the point of a bullish trend, buyers have the opportunity to buy at a relative low price while bat the point of a bearish trend, sellers take the advantage in the market to sell their assets at higher price then make gains but We should never think that when ever this candles crosses the regression line it gives good signals of both bearish and bullish trend because it maybe a very weak bullish or bearish trend hence giving out false signals.
How ever, by not actually taking into account the highs and lows of the periods, we should make sure that the closing price of the asset should either be higher or lower and when it's higher or lower and the linear regression touched Is closed with the candle, we could now evaluate whether the candle is long or short which could now lower the asset price then we could now close the candle with the linear regression
Hence in other to determine the length wether it's strong or weak, let makes sure the price should cross above or below the previous level and when this is done, we could now open our positions when strong signal is being generated by indicating wether it's a bullish or bearish movement

Looking at the chart above, we can see how there are three strong signals each signifying both bearish and bullish trend.
For Bearish trend, we see how the candles make a cut along the linear regression line hence enabling a large fall in the prices of the "LTCBTC" hence making the candle to end up closing below the previous point. At this point we see that market is dominanted by sellers emmidiately when a strong signal has occurred
For Bullish trend, we see how the candles make a cut along the linear regression line hence enabling a large increase in the prices of the "LTCBTC" hence making the candle to end up closing above the previous point. At this point we see that market is dominanted by buyers emmidiately when a strong signal has occurred
5. Explain how the moving average indicator helps strengthen the signals determined by the linear regression indicator. (screenshot required)
The Moving Average (MA) indicator is quit similar with the Linear Regression (LR) indicator but using only the Linear regression on our chart will normally give less accurate results than combining and reinforcing it with a Moving Average indicator which will give a more greater accurate results.
We should know that using just the linear regression indicator, by using square values to determine trading signals from the the regression line, it may give s delayance in generating the signals and hence gives out more fals signals but reinforcing it with a Moving Average indicator, trading signals will be more precise especially when the two indicators Cross each other as signals will now be generated with less delays with a more dynamic system where the price of the asset will vary in accordance to the trend of the indicators. Less false signals will be generated since the trader will be able to figure and filter out all the false signals. So see that traders can easily filter out any false signals with the help of this two indicators bec they give double confirmation of signals, be it positive or negative

From that chart above we see how the moving average indicator has helped in strengthening the signals produced by the linear regression indicator because the point where both indicator cross each other as highlighted on the chart above on both cases of bullish and bearish movement. We see that we can be able to filter out false signals very easily just by looking at the two indicators and bring out only positive signals that will lead to accurate prediction
6. Do you see the effectiveness of using the linear regression indicator in the style of CFD trading? Show the main differences between this indicator and the TSF indicator (screenshot required)
As we have discussed previously about the LRI, we should know that this indicator in CFD trading is very liable and more beneficial in determine long term trading simply because it react at a slow rate with the asset price by following the trend of the asset price more carefully
But we should also know that the Time series forcast(TSF) indicator is quite similar to that of the LRI in the sense that it is instead more reliable and very effective in determine short term trading simply because it reacts with asset price at a very fast rate but also follows the asset trend direction same as the LRI indicator

Looking at the ADAUSD chart above, we will notice that the TSF indicator reacts very fast with the asset price if we carry out short term trading with the pair of ADAUSDT
Difference Between LRI and TSF indicator
We see that this Indicators a quite similar, but I will figure out some few differences with this two indicators
The LRI is usually use by traders for long term trading because its more reliable and work best for the Long term trading While the TSF indicator is usually use for short term trading since it reacts very fast with the asset price
Since the LRI is use for long term trading, we can see that it's less reactive to price while the TSF indicator is more reactive with price since it is usually use for short term trading
For LRI, the asset price doesn't join the slop to the end of the linear regression line of the indicator while for the TSF indicator, the asset price join the slop towards the end of the linear regression indicator indicator line
7. List the advantages and disadvantages of the linear regression indicator:
We should know that no matter how good something is, it may have some few disadvantages which in this case, the Linear Regression indicator is not an exception because despite it's numerous advantages, it also have few disadvantages as well.
| Advantages of LRI | Disadvantages of LRI |
|---|---|
| It is extremely easy to determine asset trend using this indicator | never 100% accurate and can only be best by combining it with other indicators |
| It is highly receptive to asset price hence reacting fast so as to help traders determine trend reversal | since it's highly reactive to asset price, it may give so many false signals to traders |
| Very simple to read and understand this Indicator by all traders be it new or old | Not very good for a higher volatile crypto market simply because of it react very fast with price hence generating to many false signals |
So far, we I have been able to give a detailed explanation of the Linear Regression indicator (LRI) and I have given its uses and how how it is usually calculated and I successfully showed how to add this indicator in a chart. I also showed how it is configured and base on research including the professor's lesson, I also discovered that this indicator is best suitable when using it a period of 66.
We have also seen how this Indicator is very suitable in determine trend directions and trend reversal and base in price crossing strategy, we have seen how the indicator can be use to determine both bullish and bearish movement and we saw how the moving average indicator help in strengthening the signals produced by this LRI.
We have seen how effective using this indicator in carrying out CFD trading and we came in conclusion that the LRI is best suitable for long term trading While the TSF is best suitable for short term trading simply because it reacts very fast with the asset price. We also saw that this indicator also have pros and cones simply because it can never be 100% when use alone to determine trend directions and trend reversal
Thanks so much Professor @kouba01 for this wanderfull and beautiful lectures because I have been able to grabbed so much knowledge from it
CC
@kouba01
NB: unless or otherwise Stated, all my unsourced screenshots are taken from tradingview.comand my cover photo is edited using PixelLab