Supertrend Indicator - Crypto Academy[Advance course] /S5W7-Homework Post for kouba01

1. Show your understanding of the SuperTrend as a trading indicator and how it is calculated?
In a crypto trading market, every trader usually look for good indicators and use so as to come out with accurate results because it's never possible to Carry out trading without the use of good technical indicators. Trading without using good technical indicators will always end up blowing the entire account of a trader. We see here how important indicators come into play because trading with the use of a good technical indicator will always gives hoped to the traders because the indicators helps them in carrying out technical analysis on a chart using a pair of crypto currencies
But it should be noted that Indicators work differently in carrying out technical analysis on a chart and there are so many technical indicators that traders can use so as to carry out technical analysis and come out with accurate results. It should also be noted that using one indicator to Carry out technical analysis on a chart is never 100% accurate but looking for good indicators that work best together and combining them always boost the chances of giving out 100% accurate results most times especially when a traders prediction favours he/she.
Out of the many indicators use by traders, Super Trend Indicator is another very good indicator which we will be discussing
A Supper Trend Indicator is a trend following Indicator which work best in determine the direction of a trend to see wether it's a bullish or bearish trend. Just like other indicators, the super trend indicator usually works on a price chart of a crypto currency pair. On a price chart, this indicator works in determine if the price of the asset will go up, down or sideways since the price of an asset can never move in one direction forever.
One good thing about this Indicator is that it's very simple to use both by new or veteran traders since it's base mainly on proceeding volatility of highs/lows and also the average value of candles on a chart and it's extremely very important because it's build up of two parameters namely multiplier and periods which shows how price it's values can be determined. This parameters which are Periods[ use as verage true Range (ATR)] and a Multiplier have both default settings of 10 and 3 respectively. This two parameters have two different functions because for the parameter of period, it functions in a way that a trader usually chooses his desired period (but as from 10 upward) and then use it to calculate the length of the trend since the period is use in determine the length of every trade carried out. Then the Multiplier factor usually determines the distance between both over trend and mean
This indicator Is very similar to an MA(moving average indicator) and works best in intradays especially on a plotted chart of 10-15% since traders can easily look for false signals and filter it out. How ever, this Indicator also work great for day and long hours of trading especially when combined with other indicators in other to track false signals and filter it out. How ever, this indicator works best on the period of time chosen by the trader in accordance to the volatility of the market
How to calculate Super Trend Indicator
As I earlier said, the super trend indicator have two parameters (period and it's multiplier factor). Therefore we can determine it base on both it's Period and it's Multiplier factor
Since this usually shows direction, we can determine it by calculating it's lower and upper band then also it's average true Range
For upper band,
Upperband = [Low + High] ÷ 2 + Multiplier × ATR
For Lower band,
Lowerband = [Low + High] ÷ 2 - Multiplier × ATR
Where,
ATR = [[ 13 × Prior ATR] + current TR] ÷ 2
Where 14 is the period and the derivative of the ATR is done by multiplying the first ATR with 13
Then the current TR is determined by adding it then divide now with the period
Calculation of downlines
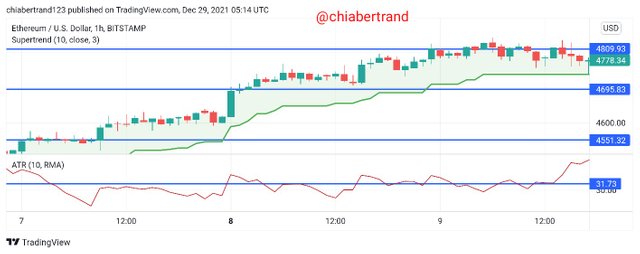
Screenshot from tradingview.com
From The chart above, you will noticed that I have added the ATR Indicator to the Supertrend indicator and I have configured it by changing it's default settings from 14 to 10 so that it should have exact period with the Supertrend indicator. So in other to calculate this downtrend values, I had to mark them with the horizontal lines so as to see the values clearly from the candles. Follow me up for the calculations below
High = 4809.93
Low= 4695.83
ATR = 31.73 which is for 10 periods
Multiplier = 3
Hence applying the formula for Lower band such that
Lowerband = [Low + High] ÷ 2 - Multiplier × ATR
Hence
Lowerband = [4809.93 + 4695.83] ÷ 2 - [3×31.73]
4,752.88 - 95.19 = 4,657.69
Lowerband =4,657.69
Calculation of Upperlines
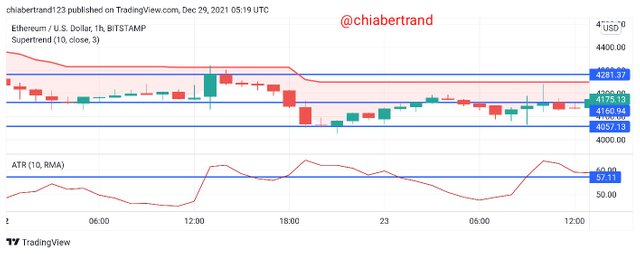
Screenshot from tradingview.com
From The chart above, you will noticed that I have added the ATR Indicator to the Supertrend indicator and I have configured it by changing it's default settings from 14 to 10 so that it should have exact period with the Supertrend indicator. So in other to calculate this uptrend values, I had to mark them with the horizontal lines so as to see the values clearly from the candles. Follow me up for the calculations below
High = 4281.37
Low= 4175.17
ATR = 57.11 which is for 10 periods
Multiplier = 3
Hence applying the formula for Lower band such that
Upperband = [Low + High] ÷ 2 + Multiplier × ATR
Hence
Upperband = [4281.37 + 4175.17] ÷ 2 - [3×57.11]
6,368.935 + 171.33 = 6,540.265
Upperband =6,540.265
Uses Of Super Trend
With the help of Super Trend Indicator, traders can be able to determine an know the direction of a trend wether bullish or bearish since it's a trend following Indicator
This indicator is extremely very good because both new and experience traders can use it very easily
2. What are the main parameters of the Supertrend indicator and How to configure them and is it advisable to change its default settings? (Screenshot required)
The Supertrend indicator indicator has just two main parameters which I have earlier mentioned above which are Periods and multiplier and the period stand for Average True Range (ATR) this two parameters have default settings of 10 period for ATR and 3 for the ATR multiplier
How To Add Super Trend indicator On A Chart
In other to perform this task, we have to first of all Log in to the official site of tradingview.com
Step1
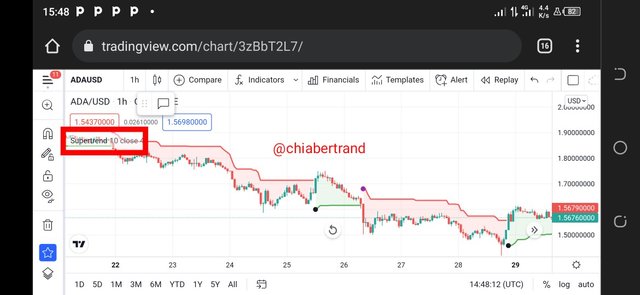
Here is chart which consist of a pair of ADAUSD
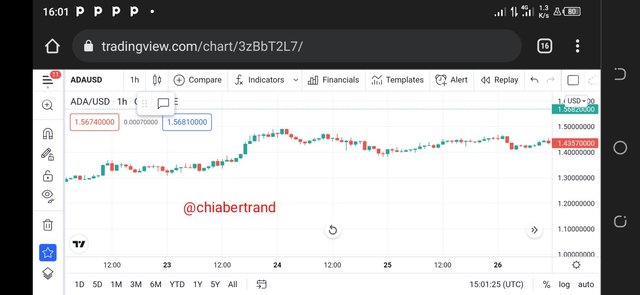 Screenshot from tradingview.com
 Step2
I now navigate to the top of my chart and click on the fx button
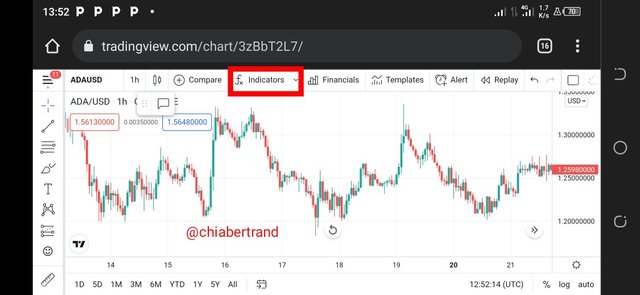 Screenshot from tradingview.com
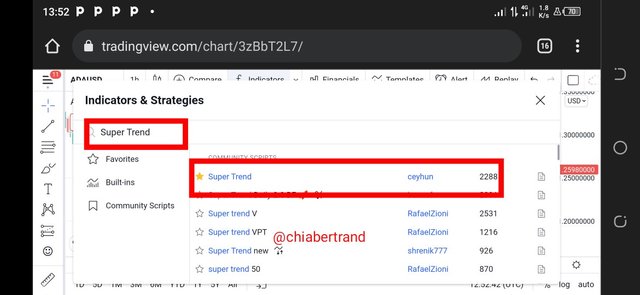
 Step3
I now type Super Trend in the search box and choose Super Trend and then click on it. After clicking on the indicator, I now go back to my chart
 Screenshot from tradingview.com
 The indicator have successfully been added to the chart
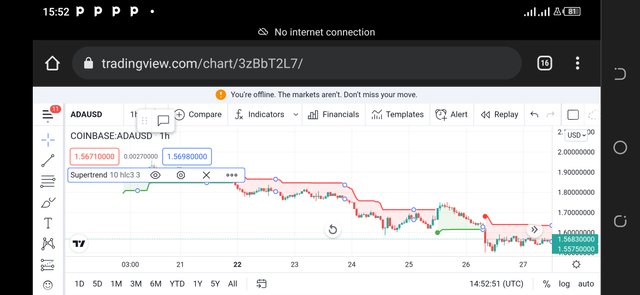 Screenshot from tradingview.com
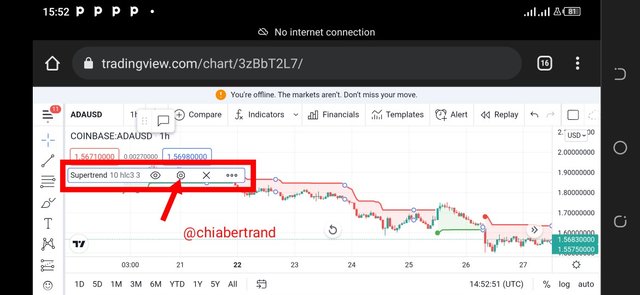
 Step1
I will have to click on the custom window of the indicator then when it appears, I now click on setting as shown below
 Screenshot from tradingview.com
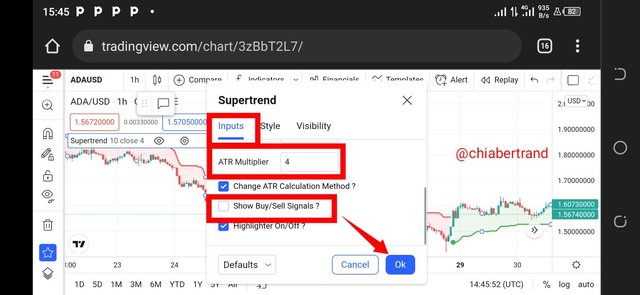
 Step2: Input
The input has a default value of 10 period for ATR and 3 period for ATR multiplier and it's source was hlc3. So I decided to change its ATR multiplier from 3 to 4 and it's source from hlc3 to close. I also removed the buy/sell signals from my chart so that it should not be disturbing me when I'm writing out things on the chart. Thereafter, I clicked on ok button below
 Screenshot from tradingview.com
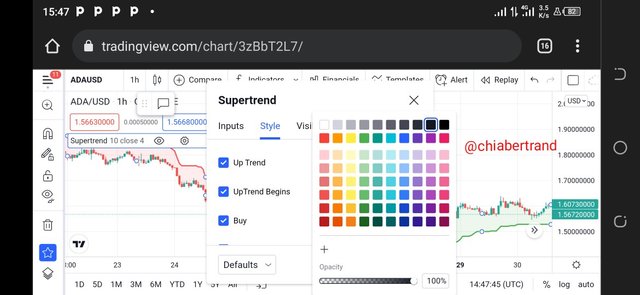
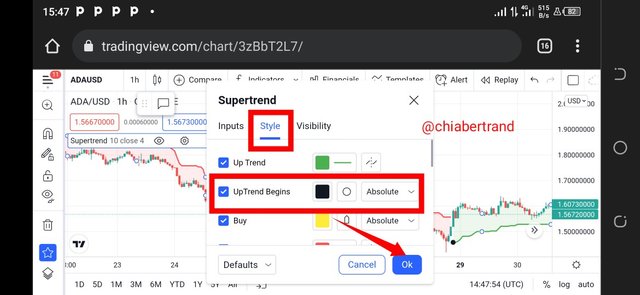
 Step3 Style
I configure the colors so as to deferentiate both uptrend, downtrend, buy and sell by setting them with different colors
 Screenshot from tradingview.com
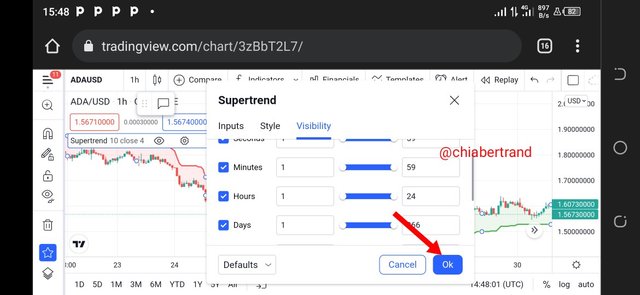
 Step4: Visibility
I allow all the visibility setting to it's default settings
 Screenshot from tradingview.com
 Now going back to my chart, I see that I have successfully configure it to my taste as seen below
 Screenshot from tradingview.com
 I think it's advisable to change its default settings because not all crypto assets trend thesame in the market. So it's good to change its default settings depending on how trending the market is at that particular period of time. But I will be backing up this question by using charts
We should first of all know that this indicator can work at any chosen time period depending on the volatility of the market and living it at its default settings may still be good but can be less effective. So for me, changing it's default settings is good because it will be able to give a more price reading and can extremely be effective and work best when combined with other indicators.
So deciding the best settings for this Indicator is done simply by making several attempts on any chosen crypto asset and changing the default settings of the indicator to see which time frame and period is suitable for the particular crypto asset so that it's effectiveness works best at that particular time frame and period.
For example, if at a default setting, where the Multiplier is equal to 3, the crypto market is forecasting and indicating a lot of exit points, it will be preferable to change its default settings and set it higher so as to reduce a lot of exit positions in the crypto market, hence giving you few entry points which you can now choose the best one from the points
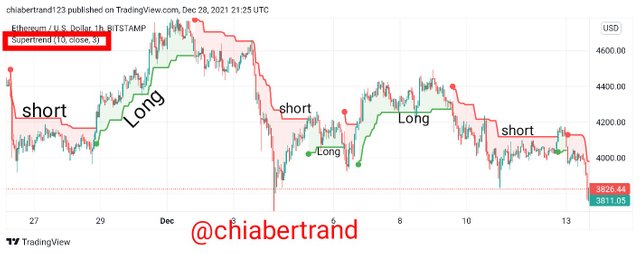
Screenshot from tradingview.com
Looking clearly at the ETHUSD chart above, we can notice that the market generates lots of signals as we can see three signals for both buy/sell but we can really be precise with this signals.
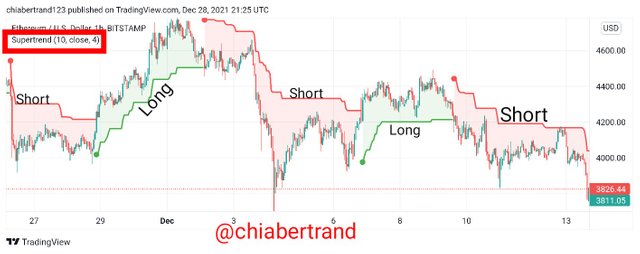
Screenshot from tradingview.com
Looking at the chart above, we can see how this signals have been reduced as I had to change its default Period of 3 to 4. I now saw only two entry positions for buy and a more precise entry points
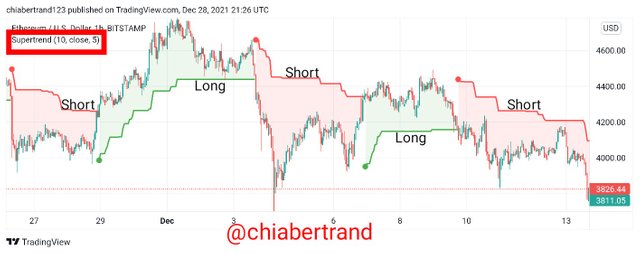
Screenshot from tradingview.com
Looking at the chart above, I alternate the period of the Supertrend indicator from 4 to 5 and it gave me a more precise reading from the signals and I saw that not much signals was generated as in the case of the chart with a period of 3.
3. Based on the use of the SuperTend indicator, how can one predict whether the trend will be bullish or bearish (screenshot required)
In other to highlight the directional trend and also identify signals of the changes in trends using the the Super Trend indicator is somehow very easy and I will be explaining it below
First thing is to know that this Super Trend indicator usually moves on the chart following the asset price and time so as to determine the next direction of the asset price for a long period without experiencing any Breakout even on small corrections in between the trend. So we see that this Indicator is generally use to identify the trend direction so that traders could determine wether the trend is bullish or bearish because this indicator moves in thesame direction of the trend and when ever this indicator move up or down following the trend, traders could use it to determine if there is a new trend which could be bullish or bearish signaling buy/sell positions
This implies this indicator is very good because it enables traders when to enter a trading position or tells them when to exit from or continue at that particular position
For Bullish identification, the super trend indicator usually moves below the asset price in an uptrend direction
The strategy for a bullish movement is when If there are lots of bullish signals in the market, it implies only buy entries are taken into consideration since the market is signifying the buying of the particular crypto asset and if the market is having lots of mixed signals (too much bullish and bearish), traders should hold on and Don't enter the market during that period
This can be identified in the chart below
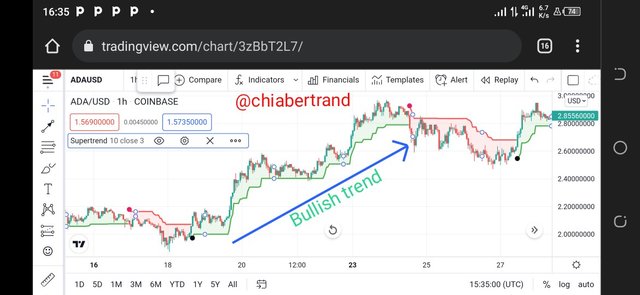
Screenshot from tradingview.com
Looking at the chart above, we can see how there the Super Trend indicator moves continually upward with price for a long period of time without experiencing any form of breakout signifying bullish movement.
On the other hand, for Bearish identification, the super trend indicator usually moves above the asset price in a downtrend direction
The strategy for a bearish movement is when If there are lots of bearish signals in the market, it implies only sell entries are taken into consideration since the market is signifying the selling of the particular crypto asset and if the market is having lots of mixed signals (too much bullish and bearish), traders should hold on and Don't enter the market during that period
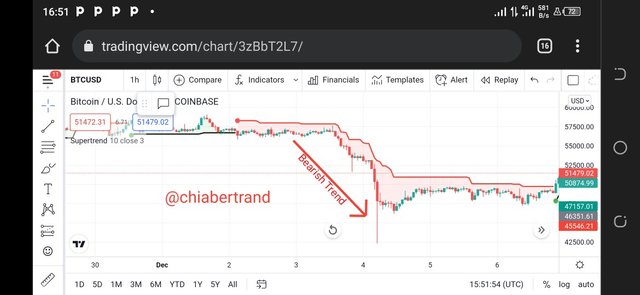
Screenshot from tradingview.com
Looking at the chart above, we can see how there the Super Trend indicator moves continually downtrend with price for a long period of time without experiencing any form of breakout signifying bearish movement.
4. Explain how the Supertrend indicator is also used to understand sell / buy signals, by analyzing its different movements.(screenshot required)
The Supertrend indicator is extremely very very easy to spot out buy/sell signals in a Trading market because this indicator works in opposite direction to the chart. For example, if the chart moved upward and in a scenario the Supertrend indicator moves downward, at this point of time we should be expecting to enter a position at any moment when the chart turns opposite to the Supertrend indicator and we will confirm it with a color change from the indicator. Emmidiately the color changes due to a change in direction with the Supertrend indicator, it's the best perfect moment we should enter a buy/sell position with respect to the color either green/red
In a scenario, in other to close a Market position, we will still need to wait for the market to breakout and then start moving in the opposite direction to the previous movement and we can confirm that also through the color change from green to red or red to green from the indicator depending on the previous direction and Color from the indicator. When that happen, the position will close emmidiately
For a buy positions or signal, the color from the indicator will be green and it will cross below the candlestick moving in an upward direction together with the price of the asset. At that moment, we can identify buy positions very easily from the chart as seen below from my screenshot
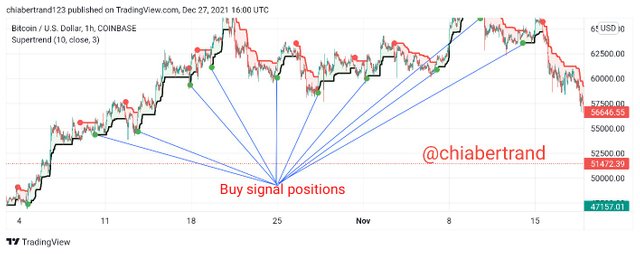
Screenshot from tradingview.com
We can identify so many buy signals from the chart above at any moment when the price of the asset moves upward together with the Supertrend indicator, and this can be confirmed as the Supertrend indicator possesses green color below the candle moving uptrend together with the asset price
For a sell positions or signal, the color from the indicator will be red and it will cross above the candlestick moving in a downward direction together with the price of the asset. At that moment, we can identify sell positions very easily from the chart as seen below from my screenshot
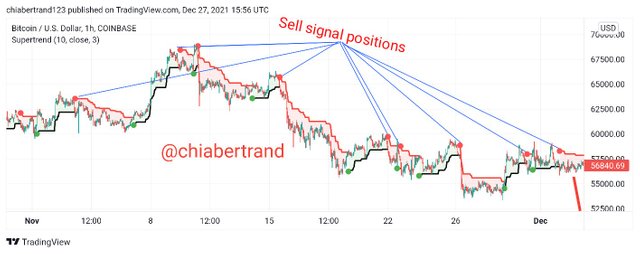
Screenshot from tradingview.com
We can identify so many sell signals from the chart above at any moment when the price of the asset moves downtrend together with the Supertrend indicator, and this can be confirmed as the Supertrend indicator possesses red color above the candle moving downtrend together with the asset price
5. How can we determine breakout points using Supertrend and Donchian Channel indicators? Explain this based on a clear examples. (Screenshot required)
Determine breakout by this indicator is usually done by combining with a Donchian-channels since this channel usually indicates highs and lows in a chart as the price moves with time and this Donchian-channels usually work best with longer periods of time as traders will be able to see and determine which types of Signals the channels are producing very easy
Now determine breakout using this Indicators is a very technical strategy which if traders work it out very well, they will be able to determine breakouts in the market since the Supertrend indicator will function only in filtering out the trends while the Donchian-channels will function only in generating values during highs and lows price of assets moves within a particular period
For Bullish breakouts,
It occurs when ever an upper limit is rupture indicating that the Supertrend indicator is in an Uptrend movement, a long position will be open. At this particular point, the trader can now determine the Breakout very easily and then open a buy entry emmidiately when two consecutive candles come out from the Donchian-channels.
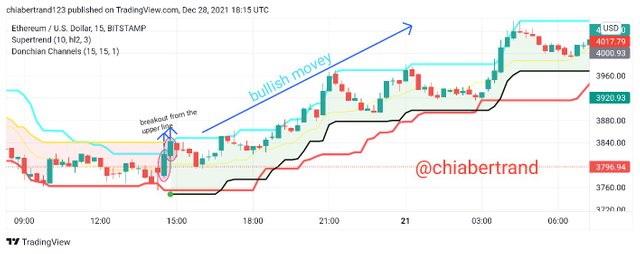
Screenshot from tradingview.com
From the ETHUSD chart above, we see how there was a breakout from the Donchian-channels at the upper line which indicates a buy signal position because there was a two consecutive candles that moved uptrend. Then we also see how the Supertrend indicator filtered out the signal and we had a clear bullish formation
For Bearish breakouts,
It occurs when ever a lower limit is rupture indicating that the Supertrend indicator is in a downtrend movement, a short position will be open. At this particular point, the trader can now determine the Breakout very easily and then open a sell entry emmidiately when two consecutive candles come out from the Donchian-channels
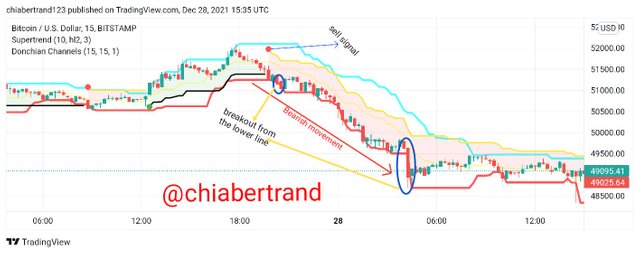
Screenshot from tradingview.com
From the BTCUSD chart above, we see how there was a breakout from the Donchian-channels at the down line which indicates a sell signal position because there was a two consecutive candles that moved downtrend. Then we also see how the Supertrend indicator filtered out the signal and we had a clear Bearish formation
6. Do you see the effectiveness of combining two SuperTrend indicators (fast and slow) in crypto trading? Explain this based on a clear example. (Screenshot required)
Like I said before, the super Trend Indicator is extremely important to traders because it can't only be more effective when combined with other indicators but can also work best when combined with another super trend indicator but in this case, a fast Supertrend is added to a slow Supertrend indicator and this is usually done by changing a default setting of one indicator to higher settings like (21 , 2) which will act like a fast indicator and then allowing the other one to it's default settings which will act as slow indicator.
For Buy Confirmation,
This double confirmation can now be determined at any moment when ever a curve moving very fast crosses over the slow curve or just touches the slow curve that Is from the bottom to the top implies that the position is a long position and we can enter a buy position at that particular time because the fast and slow curves will automatically turn green then and this usually work best during long periods of trading
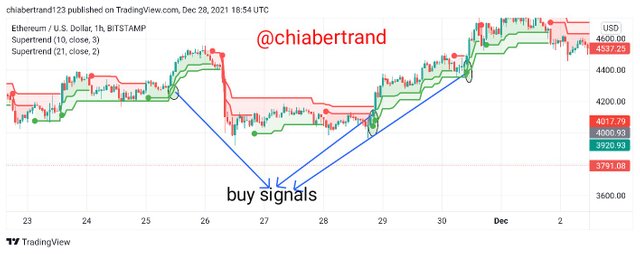
Screenshot from tradingview.com
From the ETHUSD chart above, we see how it was extremely easy to identify buy signals by using the both the slow and the fast Supertrend indicator because anytime when the fast Supertrend indicator crosses the line of the slow super trend indicator from below the price of the ETHUSD. At those points, traders can be confident of taking good trading positions anytime they crosses together
For Sell Confirmation,
This double confirmation can now be determined at any moment when ever a curve moving very fast returns under the slow curve or just touches the slow curve that Is from the bottom to the top implies that the position is a short position and we can enter a sell position at that particular time because the fast and slow curves will automatically turn red in color and this usually work best during long periods of trading
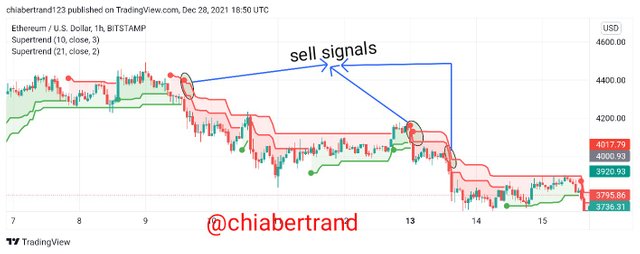
Screenshot from tradingview.com
From the ETHUSD chart above, we see how it was extremely easy to identify Sell signals by using the both the slow and the fast Supertrend indicator because anytime when the fast Supertrend indicator crosses the line of the slow super trend indicator from above the price of the ETHUSD. At those points, traders can be confident of taking good trading positions anytime they crosses together
7. Is there a need to pair another indicator to make this indicator work better as a filter and help get rid of false signals? Use a graphic to support your answer. (screenshot required)
Like I said earlier, there is no indicator that can ever give out accurate results when use alone. So there is always a need to combine two to three indicators on the price of an asset so as to come out with accurate results. Again combining two or three indicators on an asset price usually helps to filter out false signals and give precise and accurate signals for traders to take good entry positions in the market. Combining indicators always eased traders to confirm signals and breakouts in the market.
But traders should know which types of indicators that can be combined together for effective results because not all indicators can work best together.
So today, I will be combining the Supertrend indicator with RSI indicator in other to be able to confirm signals that the market produces wether overbought or oversold because this two indicators work extremely very together.
This RSI indicator consist of overbought (when above 70 mark) in a Bearish market and oversold (when below 30 mark) in a bullish market and the strategy of this Indicator functions when ever the RSI indicator signifies if the market is overbought or oversold, the Supertrend indicator receives the signals from the asset price and confirms it if it's false signals. If the signals are true, then it signify to traders that it's good time to invest by taking their entry positions at those points. Let's discuss this practically using the price chart below
For Buy signals in a Bullish market
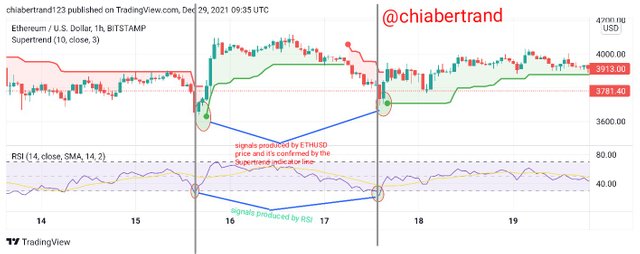
Screenshot from tradingview.com
From the ETHUSD chart above, we see that any instance when the RSI indicator gives signals of overbought, the Supertrend indicator will confirm it from the price movement to see if it's true or false signals. Once it's true signals, traders will be now able to start investing by taking buy positions produce by both the RSI indicator and the Supertrend indicator as seen from my chart above. Those are very good entry positions for traders place buy orders in the market
For Sell signals in a Bearish market
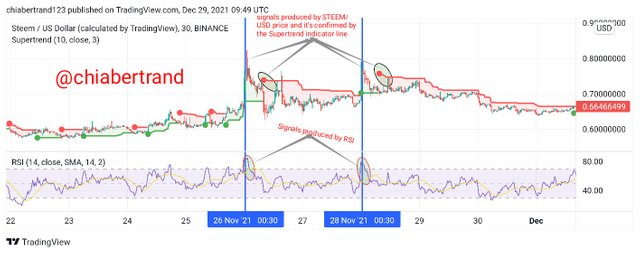
Screenshot from tradingview.com
From the ETHUSD chart above, we see that any instance when the RSI indicator gives signals of oversold, the Supertrend indicator will confirm it from the price movement to see if it's true or false signals. Once it's true signals, traders will be now able to start investing by taking sell positions produce by both the RSI indicator and the Supertrend indicator as seen from my chart above. Those are very good entry positions for traders to place sell orders in the market
8. List the advantages and disadvantages of the Supertrend indicator
Though the numerous advantages of this super trend indicator, we should know that it also have few disadvantages which I will be explaining below
| Advantages of Super Trend indicator | Disadvantages of Super Trend Indicator |
|---|---|
| The Indicator is a very good technical indicator because it works extremely very well in trending markers by giving out clear trend directions | One bad thing about this indicator is that it gives out poor signals anytime prices of assets moves in ranges |
| It work best when combined with other indicators in other to confirm signals and breakouts | This indicator is never 100% accurate when using it alone because it may generate false signals in the market |
| This Indicator is very easy to understand and to use by both new and experience traders and can be use by them to make a very fast decision in the market | Another bad situation about this indicator is that it functions only when the market is trending and doesn't support other conditions like sideway movement. |
So far, we have had a good understanding of the super trend indicator and we said it's a trend following Indicator which work best in determine the direction of a trend to see wether it's a bullish or bearish trend. We also saw how we can calculate this Indicator by using two parameters of period and it's Multiplier.
We also saw the main parameters of the super trend indicator and how to also configure it by changing it's default settings. Again, using graphical analysis, we saw how easy it was to predict whether a trend is bullish or bearish and we are how it can be use to understand good buy/sell positions in a trending Market.
We also saw how to look for breakout points by combining it with the Donchian-channels and also saw it's effectiveness by combining it with two super trend indicator (fast and slow) where one is slow (still at default settings of 10 3) and the other one is fast(change it's default settings to 21 2). We saw how good and accurate the indicator works when combining it with other indicators so as to filter out false signals from the market.
Thanks so much Professor @kouba01 for this wanderfull and beautiful lectures because I have been able to grabbed so much knowledge about Trading with supertrend Indicator
CC
@kouba01