Trading with Volume Indicator - Crypto Academy / S4W2 - Homework Post for @Kouba01
Hello everybody
I am sure you all are enjoying session 4 of the crypto academy and acquiring knowledge about crypto. Here I am submitting my homework about Trading with Volume Indicator, hope it would be up to the required standard.

1. Explain the volume indicator in your own words.
Volume indicator
Volume indicator is a measurement of the number/quantity of assets traded in a specified time period and shows the intensity of the interest of the investor/trader in that time period. It is represented as a vertical bar in two colours below the chart.
It is a live indicator and the combination of height and colour of the bar indicates the trend of the market. The green/blue bar represents the volume when the price is rising and the red bar represents the volume when the price is falling.
Volume indicator helps me identify that what other traders and investors are looking for in the particular asset. In fact, volume plays a key role to identify the direction of the market as well used in the combination of other technical indicators to confirm the trend.
Volume is also an indication of the liquidity of the particular asset in the market. E. g. one coin might be less liquid at one exchange and have good liquidity on another exchange thus helps to choose the exchange for trading.

2. Use a platform other than Tradingview to present the volume indicator on a chart and show how to configure its parameters by justifying your choices. (Screenshot required)
Setting up of volume indicator on the chart
I decided to use investing.com to set up and configure the volume indicator.
- Landed on the https://www.investing.com/
- Navigated to Charts>>Live charts

- Selected "cryptocurrency"

- Selected 1-day chart and clicked on the indicator and searched for "Volume".

- Applied the volume indicator

Configuration of indicator
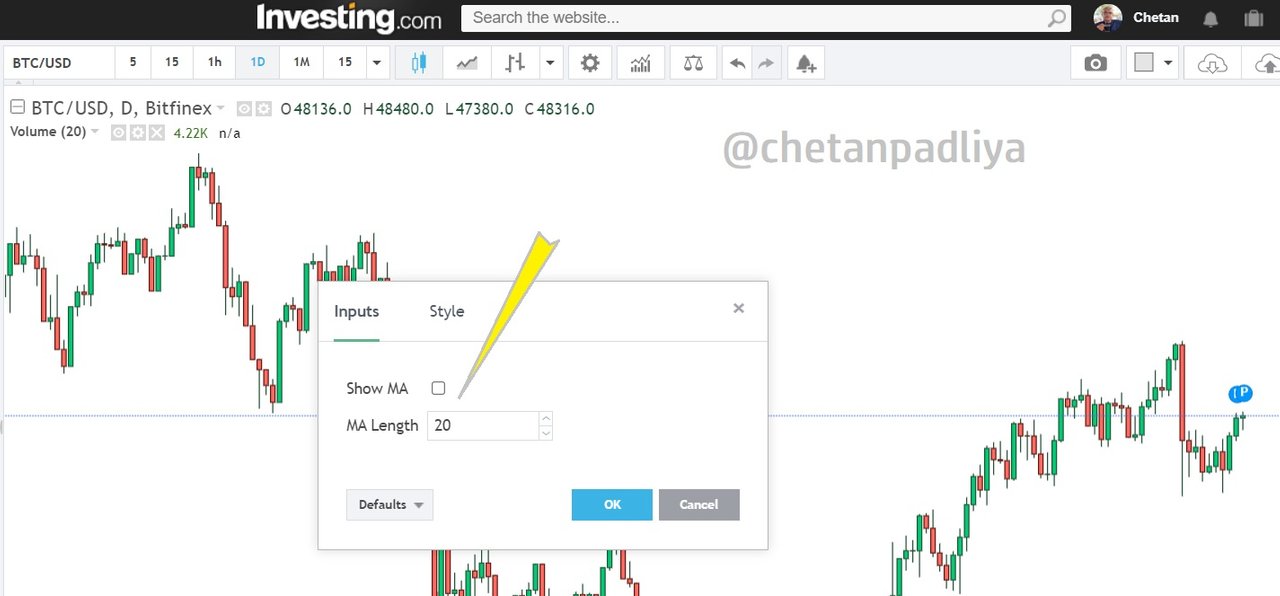
To configure the volume indicator clicked on its setting, there are 2 parameters to configure inputs and style. In input by default, it shows the moving average of 20 periods. If MA is not required it can be unchecked. I unchecked it, as will discuss on the volume indicator.
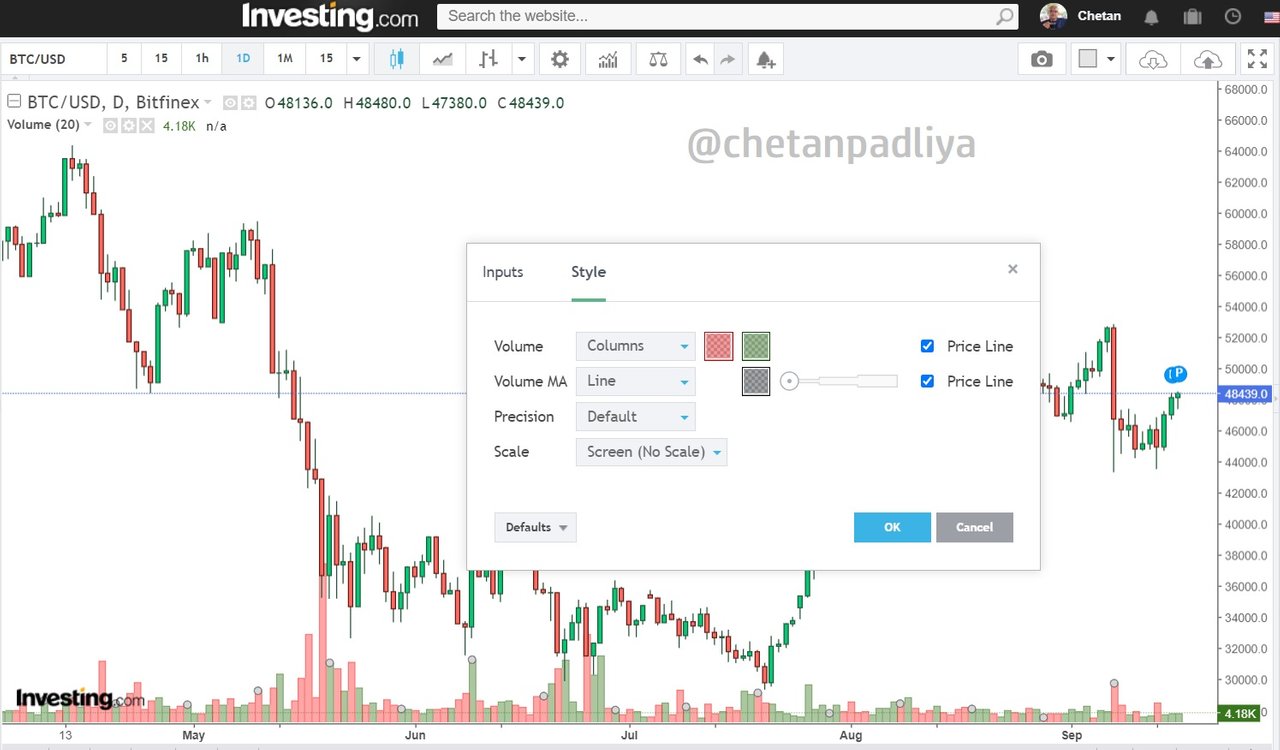
To configure the style clicked on that, there are several options viz. volume, volume MA, precision and scale.
For volume, there is are various options for how you want to see the volume indicator like columns, lines, lines with breaks, histogram, cross, area, an area with breaks etc. One can choose which is comfortable to understand. I selected the default setting columns as it is the easiest to understand.
For colour default setting is red and green I just slightly change the shade of the colour which was easily visible.
I already unchecked the MA option and kept precision to the default setting. Scale also choose no scale as selecting other options shows bar fights longer than the default, which is not comfortable on the chart.
3. What is the link between Volume and Trend and How to use volume to predict a trend reversal? (Screenshot required)
Relation between volume and trend
Volume and intensity of buying/selling pressure go together. If the volume in increasing with an increase in the price there is high buying pressure and if the volume is increasing with falling in the price there is high selling pressure in the market.
An uptrend remains to continue if the volume increases with the price movement and a downtrend also remain to continue if the volume increases with the fall in price and in case of rebound the volume decrease with a fall in price.
If the price is decreasing and volume is also decreasing then it is also considered as an upward trend. Similarly, if volume decreases with an increase in the price is indicate that the uptrend is almost over and the trend is downward.
Fall in volume irrespective of increase or decrease in the price shows the sign of trend change. An increase in volume irrespective of price fall or rise indicates the continuation of the trend.

Prediction of the trend reversal by volume indicator
Example 1 - As we discussed above that if both price and volume are going down there is a signal that sellers are not selling with intensity and the trend can be reversed
. By predicting trend reversal using volume we have to wait till the volume increases with buying. After noticing such a situation we have to wait for more for the next candle. If the next candle is also in green with increased volume there is a strong possibility of a trend reversal.

In the above screenshot of ETH/USD we can see that price and volume both are in a downward direction but after buying with volume a trend reversal is observed.
Example 2 - If the price is in an upward trend but volume is not supporting the price it could be a false upward trend signal and a trend reversal is possible. It can be understood with the chart below.

In the above chart, it is observed that price and volume are in the opposite direction thus upward trend is not convincing and a trend reversal happened and the price moves in a downward direction.
4. How to use the volume to have a signal confirmation? (Screenshot required)
To use a volume indicator as a conformation of breakout a support or resistance level must be determined first. If the price breaks the resistance level and moves upward with high volume it is an indication of breakout. Similarly, if the trend is bearish and the price breaks the support level with high volume it is an indication of a breakout for downward movement.
We can understand the above two situations of confirmation of breakout with a volume indicator, with the help of the 2 charts below.
Situation 1- In the chart below a resistance level is marked where the price tested the level and moved downward.

It is clearly visible in the chart that price took a breakout at resistance level with a long green candle. At the same time, it is also observed that the volume candle is also increased. The next candle after the breakout is closed above the previous one which is also a confirmation of breakout and trend reversal.
Situation 2 - It is just opposite to situation 1st. A support level is marked on the chart where price took the support and moved upward.

In the above chart, it is observed that the price broke the support level with a long red candle and moves in the downward direction. At the same time volume bar is also increased which indicate the breakout happened with the high volume. the next candle is also below the support level which is also a confirmation of breakout in the downward direction.
5. How does the volume reflect the evolution of prices in the charts and why does the volume sometimes anticipate the price? (Screenshot required)
Price rise with volume growth
Sometimes the volume clearly indicates the growth in the price. To observe this pattern we have to analyze some previous volume bars. If the previous 10-20 volume bar is showing lesser volume as compared to the current volume bar there is an indication that the price growth is expected. We can understand it with the below chart.

From the above chart, it is clearly visible that the increase in volume as compare to the previous volume reflecting further price evolution. Price movement is in an upward trend after this volume growth.
When volume growth expect the price movement
Generally, a rise in volume is the indication of either upward or downward movement but sometimes the market doesn't react to unexpected volume growth and remain in a range-bound price zone. In the below chart we can understand this situation.

It is observed in the above chart that there are spikes in the volume at certain levels but the price is not reacting to volume growth. Sometimes such conditions are created by big investors to generate false signals. Volumes increases suddenly and small investors get trapped as without any confirmation with other indicators they take the position in the market in the anticipation of a good price movement.
6. Is it better to use the volume indicator alone or use it in parallel with another indicator when trading? Justify your answer
It is always advisable to use more than one indicator to confirm the trend and initiate the trade. The same applies to volume indicators also. There are several indicators that can be used with volume indicators like MA, MACD, RSI, resistance and support etc. Here I combined RSI with volume and observed some signals.
In the chart below, RSI is applied. The Default range of RSI is between 30 to 70. RSI when RSI break 70 levels and return back below 70 it is considered a sell signal. Opposite to this if RSI breaks 30 levels and returns back to above 30 is considered a buy signal.

In the above chart, we observed that there are 2 times RSI went above 70 and returned back. At the same time, if we see the volume increased as RSI returned back below 70, at this point, a downward trend is confirmed and a sell entry trade can be initiated. Here RSI gave a signal in advance and it is confirmed by volume.
7. The volume indicators are multiple, choose one of them to briefly explain its usefulness in crypto trading.
There are various volume indicators that have been developed on the basis of volume. Here I will discuss The Chaikin Money Flow indicator (CMF indicator).
It is considered as one of the best volume and classical volume indicators as it measures institutional accumulation-distribution. I applied this indicator in the chart below. The default setting is 21 period. A shorter period setting makes it more sensitive while a larger period setting makes it less sensitive.

In the chart above it is observed that price is in an upward direction when CMF volume reading is above the zero levels and the price is in a downward direction when the CMF volume reading is below zero levels. The higher the reading stronger the trend.
The strength of the breakout can also be confirmed using CMF reading if the price breaks the resistance and CMF is above zero it is considered as a buying pressure. In such conditions, the chances to sustain the breakout are higher.
Similarly, if CMF reading is below zero levels when price breaks the support level it is considered as selling pressure.
8. Conclusion:
Volume is a very basic indicator and easy to use indicator to know the strength and intensity of the strand. Volume is also used to confirm the breakout. There are various indicators based on volume like Chaikin Money Flow, On Balance Volume, Klinger Oscillator etc. Sometimes volume-based indicators are very useful to take the decision in trading. Like other indicators, volume indicators should be used with other indicators to make trade successful and profitable.
Thank you, prof. @kouba01 for delivering such an informative and comprehensive lecture.


Hello @chetanpadliya,
Thank you for participating in the 2nd Week Crypto Course in its 4th season and for your efforts to complete the suggested tasks, you deserve a Total|9.5/10 rating, according to the following scale:
My review :
Great job, thanks to which you managed to get a good grade, and here are some observations.
The interpretation of the indicator was general and did not go into some detail.
Your explanation of the settings choices was good.
Yes, the volume rise with the price rise (whether downward or upward) means a healthy trend and it is expected to continue, the difference of the volume from the main price trend means an expectation of a reversal of the trend or a correction.
The rest of the answers were excellent, with a slight difference in the depth of their analysis.
Thanks again for your effort, and we look forward to reading your next work.
Sincerely,@kouba01
Thank you prof for your valuable feedback.