Steemit Crypto Academy Season 3-Week 1 | Homework post for @kouba01 Ichimoku-kinko-hyo Indicator - Part 1
CryptoAcademy season 3 is more organized and I am sure the new season is going to be very informative and exciting. Before attending CryptoAcademy my TA knowledge was almost nil but after attending various lessons on TA at least I have created a base on which I can acquire a stronger and advanced knowledge about TA and other aspects of the crypto field.
I found today's lesson about Ichimoku-kinko-hyo Indicator is very interesting and informative. After reading in-depth here I am submitting my homework.
Task 1
What is the Ichimoku Kinko Hyo indicator? What are the different lines that make it up? (screenshots required)
Ichimoku Kinko Hyo indicator is not only an indicator but a system that works alone without using any other indicators. This system contains five types of indicator or lines. This is used to measure the momentum as well as to predict the future movement, support and resistance.
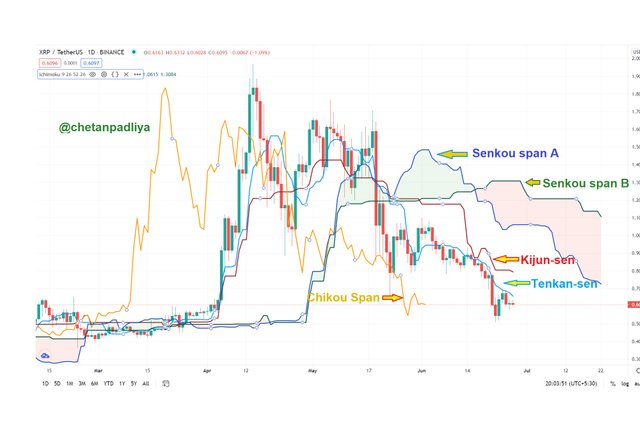
The five different lines of which it consists are known as Tenkan-sen, Kijun-sen, Senkou span A, Senkou span B and Chikou span.
Tenkan-sen - This line is also called the conversion line. Contrary to other indicators here previous high and low are included in the calculation and for Tenkan-sen sum of 9 periods high and low is divided by two. I.e.
(The highest price of previous 9 periods + lowest price of previous 9 periods)/2
The line made of these points indicates key support, resistance and reversal points.
Kijun-sen - Known as a baseline and calculated by same as Tenkan-sen but the period count is 26. I.e.
(The highest price of previous 26 periods + lowest price of previous 26 periods)/2
The resulted line can be used as trailing stop-loss points other than support and resistance.
Senkou span A - Also called leading span A and it is calculated by the sum of Tenkan-sen and Kijun-sen divided by two. It is plotted 26 periods ahead, on the chart. The line is one of the edges of the cloud.
Senkou span B - Or known as leading span B and calculated by the average of the highest and lowest point of previous 52 periods. It is also plotted the same as Senkou span A 26 periods ahead, on the chart. this line makes another edge of the cloud
Chikou Span - Called as lagging span as it is plotted 26 periods behind on the chart. This is used to show the possible area of support and resistance. It is simply the 26 periods lagged price line.
In the chart below I tried to represent all five lines.

Task 2
How to add the Ichimoku indicator to the chart? What are its default settings? And should it be changed or not?(screenshots required)
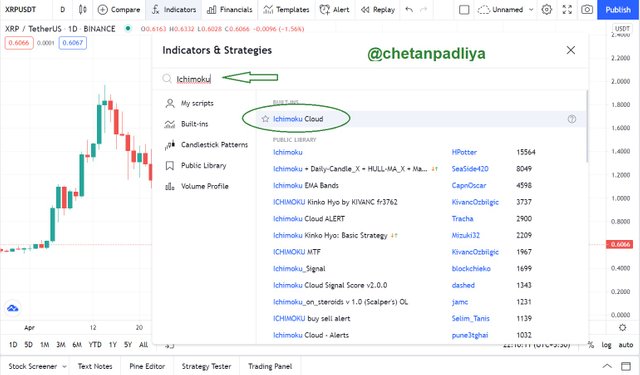
Adding of Ichimoku indicator to the chart (Stepwise procedure)
I will add Ichimoku indicator to XRP/USDT chart on the trading view site.
- Open the chart
- Clicked on Fx and searched for Ichimoku
- Selected the Ichimoku Cloud
- Clicked on the indicator setting and selected the default values for different lines.
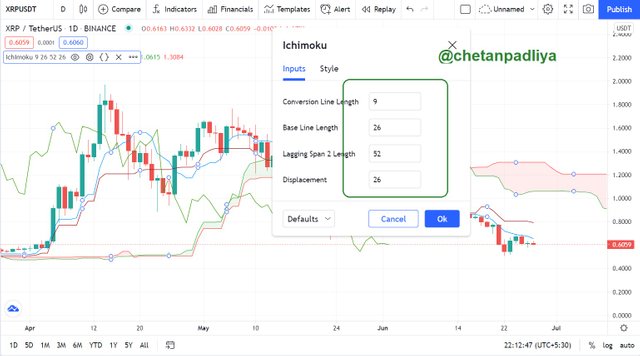
- Default values are as follows
| Line | Value |
|---|---|
| Tenkan-sen (Conversion line) | 9 |
| Kijun-sen (Base line) | 26 |
| Senkou span B (leading span B) | 52 |
| Chikou Span (lagging span) | 26 |
The default setting can be changed but it should not be changed. Default settings are not selected randomly but there was a strong reason behind that. No 9 for Tenkan-sen shows 9 working days i.e. one and a half week. No 26 is about one month and 52 represent two months.
Task 3
How to use the Tenkan Sen line? How to use the Kijun Sen line? And How to use them simultaneously?(screenshots required)
To explain the Tenkan Sen and Kijun Sen on the chart I hide other lines of Ichimoku indicator. Below is the chart only two lines are visible Tenken and Kijun sen.
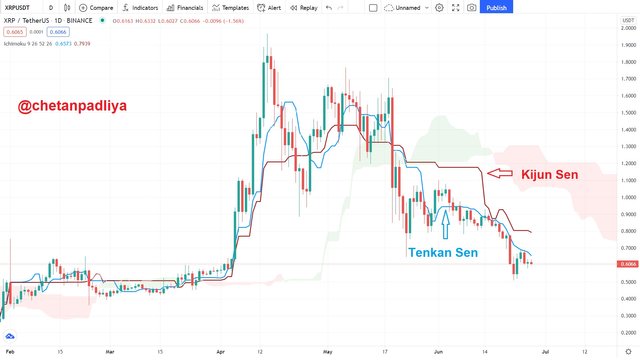
Using Tenkan Sen line - As Tenkan Sen line is the mid-value of the previous 9 periods high and low so it is close to the price movement and also the fastest moving line in the Ichimoku indicator. Although it is near to price movement and shows a short term trend it is not used alone as an indicator.
When this line is above the Kijun sen line it is considered a buy signal and if it is below the Kijun sen it is considered a sell signal. Crossover of these lines indicates trend reversal.
Using Kijun Sen line - Since this line is mid-value of previous 26 periods high and low, so its movement is slow as compare to Tenkan sen line. It also shows flat movement it means no new high and low are forming in that particular time.
It does not provide any important signal on its own so it is used in combination with Tenkan sen line to identify the trade signals when they cross each other.
Using Tenkan Sen and Kijun Sen line simultaneously - There is not much difference in the periods of both line so they move together but KS makes baseline and TS moves faster than KS. Their crossover indicates buy and sale signals as mention above.
TS and KS lines help to calculate Senkou span A that is one of the edges of the Kumo or Cloud which is the most important part of Ichimoku indicator.
Task 4
What is the Chikou span line? And how to use it? And Why is it often neglected? (screenshots required)
Chikou span is one of the 5 lines of Ichimoku indicator and it is created by plotting closing prices 26 periods behind the latest closing price of an asset. To explain it visually I created the chart below which shows how it moves with the current price.
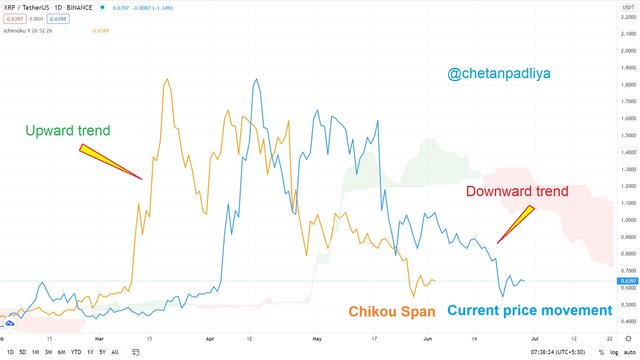
Using Chikou span - When Chikou span moves above the current price it is considered an upward trend while moving below the current price is considered a downward trend. As I indicated above in the graph.
Chikou span used as a momentum indicator and as well as a secondary confirmation tool based on its relationship with the other four Ichimoku lines. It is also used to confirm points of resistance and support.
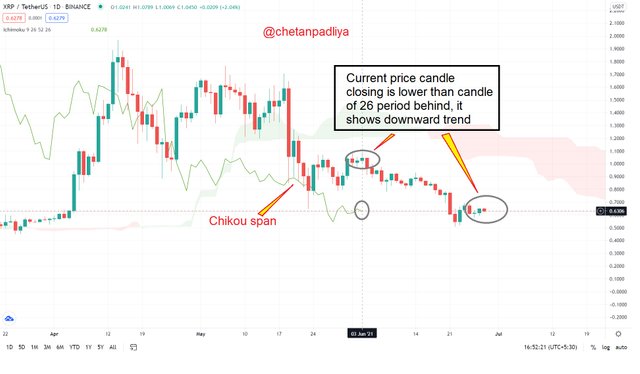
To understand it more clearly I created the below graph in which a horizontal and vertical dotted line is drawn. It shows that at the current Chikou span point current price candle closing is lower than the closing of the 26-period previous candle which is an indicator of a downward trend.
Chikou span is often neglected as there is nothing inherently predictive in this.
It is also ignored when price and Chikou span cross frequently which gives false signals.
When crossover happened and shows the trend reversal price already have significantly moved in the direction and if price has already moved by the time the signal arrives, it may not always be a worthwhile trading opportunity.
In the chart below shows how Chikou span shows wrong signals which should be avoided.
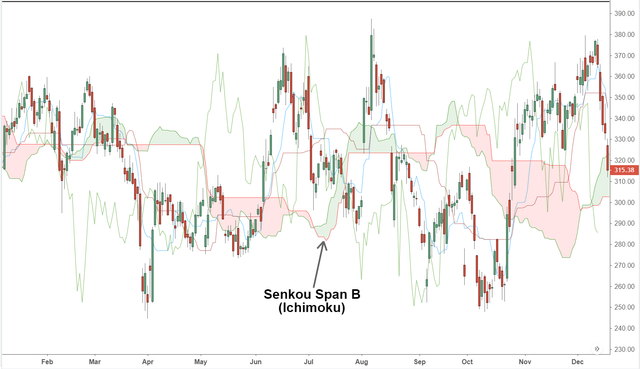
:max_bytes(150000):strip_icc()/SenkouSpanB-5c61960446e0fb000127cb41.png)
Task 5
What's the best time frame to use Ichimoku? And what is the best indicator to use with it? (screenshots required)
Indicator changes with time frame therefore the time frame depends on what type of trader you are. For day trader or scalp trader 1 minutes to 6 hours time frame is suitable and for long term trader daily to weekly time frame is the best.
Although the Ichimoku is a complete system for trading but before taking any decision, using it with another indicator is a good idea always.
The combination of Ichimoku and RSI indicator goes well. When we have to identify the trend reversal by applying both indicators gives a clear picture. We can understand it by the chart below.
RSI indicator is a momentum indicator that measures the magnitude of recent price changes in order to evaluate overbought or oversold conditions in the price of an asset.
when the RSI surpasses the horizontal 30 reference level, it is a bullish sign and when it slides below the horizontal 70 reference level, it is a bearish sign.
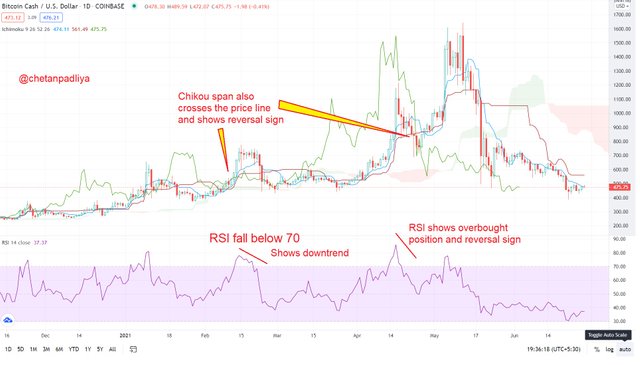
By analyzing the above chart it clearly shows that both the indicator RSI and Ichimoku showing trend reversal at the same time. When RSI indicator fall below 70 Chikou span also crosses the price line which is also a sign of trend reversal.
Thus by applying these two indicators at the same time helps to take any trade decision more accurately.
Task 6
Conclusion
After learning the first part of the Ichimoku-kinko-hyo Indicator the following points are clear
- Ichimoku-kinko-hyo is not only an indicator but a complete system of trading.
- Unlike another indicator it consists of five-line which makes it a more reliable indicator.
- This indicator works on the average of highest high and lowest low of a period. The different line has different periods. While other indicators based on the closing price of the candles.
- Tenkan sen moves more near to current price while Kijun sen is a baseline that becomes flat when no new high and low forms for a defined period.
- Chikou span is the simplest line but a very strong indicator which is plotted 26 periods behind the current price. It not only indicates the trend reversal but also helps to identify support and resistance.
I am really thankful to Prof @kouba01 for describing the lesson in an interesting way which was completely new for me. I am eagerly waiting for part II of Ichimoku-kinko-hyo Indicator.


Interesting, thanks for sharing!