{Steemit Crypto Academy - Season 2, Week 6} Elliott Wave Theory: Homework submition
Any class of Technical Analysis is somewhat difficult to understand for me as I never traded using any technicals and it is my 1st time that I am learning something about the technical analysis here is Steemit Crypto Academy.
This class of prof -fendit was really interesting for me as I learned about Elliott Wave Theory. Here is my assignment work-

Share your understanding on this lecture by answering the following questions
1. What's the application of this theory?
Elliott Wave Theory is a type of technical analysis useful for investors and traders to forecast the future move of any share, commodity, forex or cryptocurrency in the long term. This theory was introduced by R.N. Elliott in 1930 and using this theory he surprised investors and traders by making a correct guess about the bottom of the stock market in 1935.
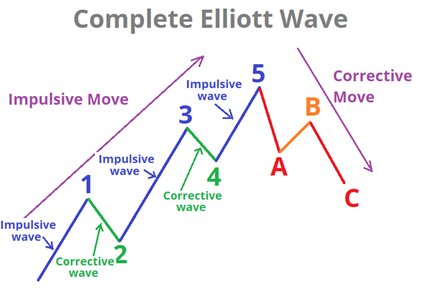
Elliott Wave theory shows that as a result of mass psychology prices move occurs in cycles and repetitive patterns form on charts. By observing these pattern it is easy to predict the future movement of any stock or cryptocurrency. These patterns formed by up and down are named waves and classified into impulse and corrective waves.
This theory is useful to predict the market reversal after a long bullish or bearish trend.
2. What are impulse and corrective waves? How can you easily spot the different waves?
According to Elliott wave theory, a complete price cycle consists of 8 waves, in which 5 are impulse wave and 3 are corrective waves.
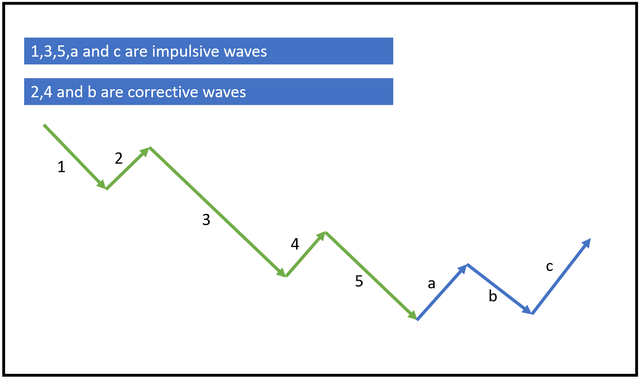
Impulse waves are in an upward direction in a bullish trend while in a downward direction in the bearish trend, in the cycle.
Impulse waves
- Wave 2 cannot be larger than wave 1
- Wave 3 can not be shorter than wave 1 and 2 and 5
- Wave 4 can not go beyond wave 3 at any time.
These rules are unbreakable and if anyone breaks trader has to reanalyze the chart.
Corrective waves
As shown in the above diagram corrective waves starts after the completion of 5 waves according to rules. These waves are labelled as A, B and C.
Corrective waves can be classified into three different categories Zigzag, Flat and Triangle.
- In the Zigzag pattern wave B is shorter than A and C and goes in the opposite direction.
- In a Flat pattern unlike zigzag, all waves are same
- Triangle pattern is difficult to spot but it indicates the low volume and volatility.
Chart 1 Bullish Market 👇
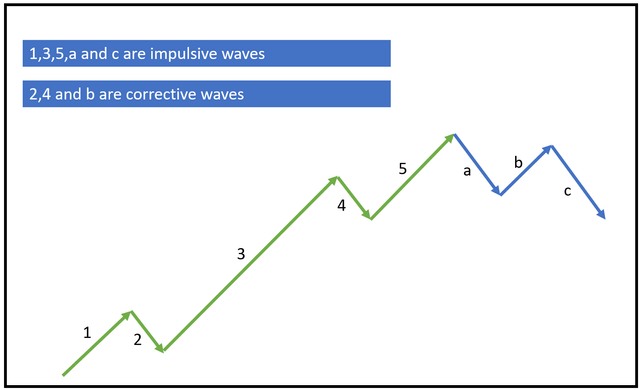
Chart 2 Bearish Market 👇
This theory is useful to predict the reversal of the market trend. If on long term chart 5 waves observed without breaking the above rules then at wave 5 most likely the market trend becomes reverse.
3. What are your thought on this theory? Why?
This theory is derived by Elliott after analyzing a long term chart and on the basis of this, he successfully predicted the market bottom so there is no doubt that this theory works. But it needs to be some expertise in identifying the pattern without breaking the rules of the Impulse wave.
This theory is purely based on the collective psychology of traders and investors so applying this with other technicals can give better results.
This theory is more successful in long term chart as compare to intraday or weekly chart so should be used accordingly.
No technical analysis or theory is 100% successful so a strict stop loss is a must while trading.
Choose a coin chart in which you were able to spot all impulse and correct waves and explain in detail what you see. Screenshots are required and make sure you name which cryptocurrency you're analyzing.
I choose XRP/USDT chart to find out Elliott wave theory. Opted for 180 days chart. 👉https://www.coingecko.com/en/coins/xrp/usd#panel
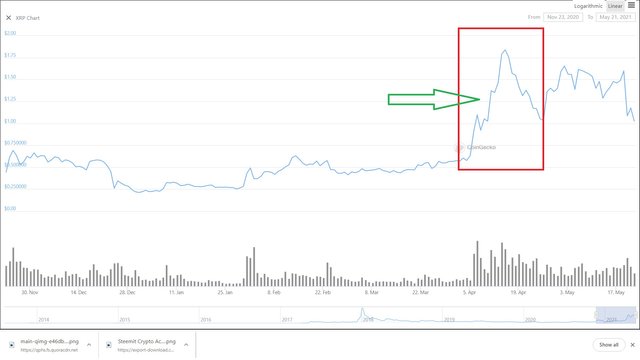
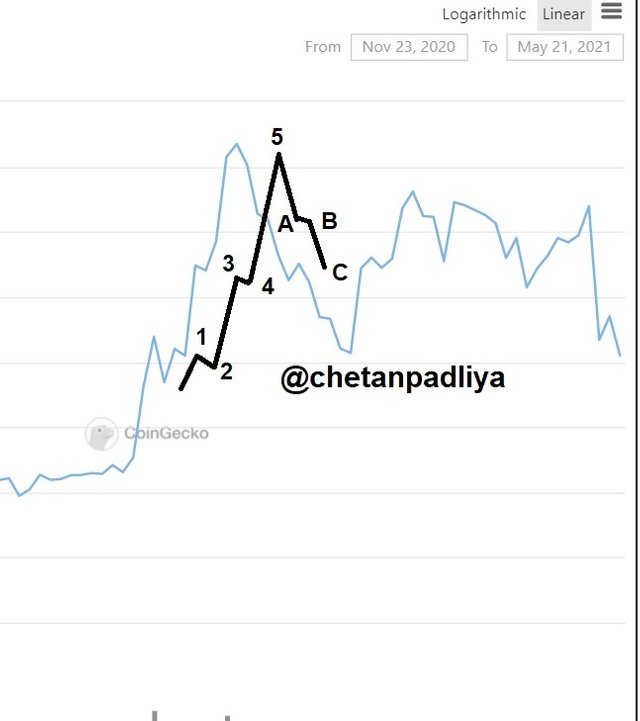
| Wave | Start price in $ | End price in $ |
|---|---|---|
| Wave 1 | 0.922 | 1.05 |
| Wave 2 | 1.05 | 1.02 |
| Wave 3 | 1.02 | 1.37 |
| Wave 4 | 1.37 | 1.35 |
| Wave 5 | 1.35 | 1.84 |
| A | 1.84 | 1.57 |
| B | 1.57 | 1.55 |
| C | 1.55 | 1.31 |
Data in the above table clearly indicate the formation of the Elliott Wave theory.
Conclusion
Elliott Wave Theory could be a good trading strategy but as far as I think is very risky as well. As identification of correct wave, formation pattern is the key to the success of this theory and for any beginner, it is difficult to identify the correct pattern. It needs a lot of professional expertise before implementing it with your hard-earned money.
I am thankful to the prof @fendit for this informative and interesting class about Elliott Wave Theory for technical analysis.
Thank you for being part of my lecture and completing the task!
My comments:
Nicely done!! :)
Good work, I really enjoyed going through it, you were very into detail and your analysis on the chart was really good!
Overall score:
7/10
Thank you prof for your valuable feedback.
@chetanpandliya great work sir👍🏻
Thanks!
You have been upvoted by @sapwood, a Country Representative from INDIA. We are voting with the Steemit Community Curator @steemcurator07 account to support the newcomers coming into Steemit.
Engagement is essential to foster a sense of community. Therefore we would request our members to visit each other's post and make insightful comments.
Thank you.