Crypto Academy Week 16 - Homework Post for @fendit : The Wyckoff Method
Different lessons at Steemit Crypto Academy on technical indicators making me more informative about technical analysis. Technical analysis in any trading is such a vast field, that required a lot of efforts and patience to understand and apply in real trading.
After attending lectures and completing homework here about different technical indicators I am sure I will be able to handle trading far better than before.
Here I am submitting my homework about The Wyckoff Method, and hope it will be up to the standard required by the professor.
.png)

Task 1
Share your understanding on "Composite Man" and the fundamental laws. What's your point of view on them?
Before writing anything about "Composite Man" would like to express my understanding of The Wyckoff Method. As Prof said this technical analysis tool was developed by Richard Demille Wyckoff.
He observed that the price of any tradable asset on exchanges can be predicted by combining various parameters like volume, price movement and time. These parameters give an idea about the supply and demand of that asset.
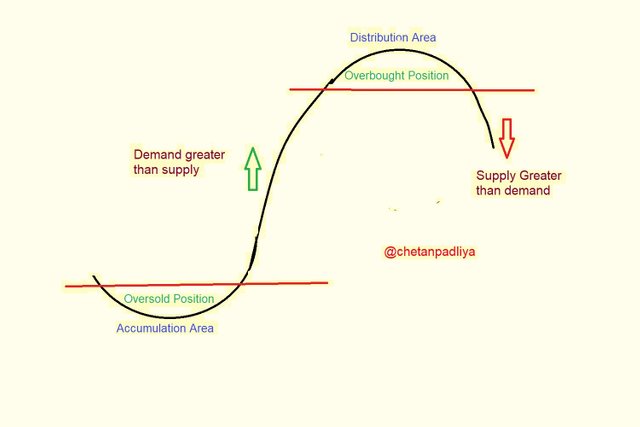
On the basis of the above parameters, he divided any chart of four major areas to understand it easily and for entry and exit strategy. Accumulation, uptrend (Demand exceeds supply), distribution and downtrend (Supply exceed demand).
Composite Man
He observed such patterns in many stocks which have good involvement of traders, institutional investors and the general public. This could not be a coincidence to repeat such a pattern again and again in different stocks. To explain such pattern in price movement he proposed a tool or can say an imaginary force governing this, and he named that as a " " Composite Man"
According to him any particular stock or market as an all should be looked at in such a way that a "Composite Man" is governing this market or stock. Further, he explained that how this invisible force "Composite Man" govern and manipulate the market.
- Composite man first start accumulation of any stock.
- Then Composite man attracts the public to take a buy position in that particular stock at this time stock moves up as more demand is created by Composite Man than supply.
- Once the target quantity is accumulated by the Composite Man (Overbought zone), stock price remains in a particular range-bound area.
- Now the Composite man decided to book profit and start selling. At this point, the stock started to move down due to selling pressure by Composite Man and as there is no supply i.e. Supply exceeds demand.
Wyckoff believed that if anybody able to understand the market behaviour of the Composite Man, many trading and investment opportunities can be identified at the initial phase of the cycle to make a profitable trade.
Fundamental Laws
Wyckoff theory based on three fundamental laws.
- The law of demand and supply in price determination.
The law is very simple and easy to understand in common life that if the demand of any particular item increases in the market its price also increases and vice versa. The same theory applies to the stock, currency and crypto market. But volume is an important factor that should be co-related with demand and supply to determine the price. The trader should study the volume bar on the chart over time with demand and supply.
- Wyckoff's Law of cause and effect
The idea is that nothing happened without a cause behind that. So the same applies to the price movement of share/crypto also. To changes price, a root cause must have been built before. Prie movement after any cause is its effect.
There are two phases before any big price movement known as accumulation and distribution.
Accumulation - As marked in the above chart, in this phase accumulation happens and it is the phase causes rising in the price. Here accumulation is the cause and price rising is the effect.
Distribution - Price goes downwards after this phase, here the distribution phase is the cause and the fall in the price is the effect.
- Law of efforts and result
As we discussed earlier price movement is the combination of demand supply and volume. Here volume is considered as an effort. If we see the price action with volume the stock can make a move in a direction, but if there is no connection established price movement could remain sideways.
We can say the higher the volume is the higher the effort, and the lower the volume, the smaller is the effort.
Task 2
Share a chart of any cryptocurrency of your choice (BTC or ETH won't be taken into account for this work) and analyze it by applying this method. Show clearly the different phases, how the volume changes and give detail of what you're seeing.
Here I selected XRP/USD pair to explain this method.
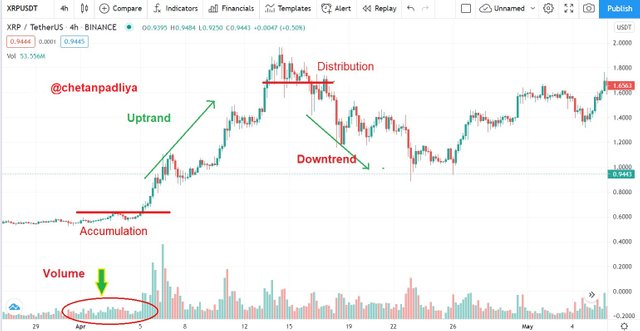
This chart is set for 4 hours time frame and I will explain Wyckoff cycle in the chart.
- Accumulation Phase - Volume is almost constant here at this phase. price is sideways as no up or down movement shows. At this phase composite man is accumulating the asset to sell at a higher price later. Volume is low it means buying is slow without affecting the price.
- Uptrend - It started to move upwards as soon as volume increases. In the uptrend phase in between small accumulation also are visible. Here Composite man attracts others to invest in the asset so the price started to go up. There are small re accumulation phases where the price doesn't go upward. After this phase distribution phase started.
- Distribution Phase - This is an overbought zone and price movement is in a narrow range for some time. Here selling started slowly. Volume is also decreased and almost constant. here Composite man starts to liquidate the asset to book profit but again start to sell in small quantity so the market doesn't fall all of sudden.
- Downtrend - This started as soon as the distribution phase completed and traders started to sell their asset to book profit. Price started to fall with increased volume. Here Supply exceeds demand so price decreases.
Conclusion
Like any other technical analysis, this method also required a lot of practice to understand and identify the patterns. It looks easy but without practice and a strict stop loss trade may go in loss.
Here it is important to identify the reaccumulation phase as if it is identified as a distribution phase a trader could be in heavy loss.
I am thankful to professor @fendit for this informative lecture that gave us an opportunity to learn something new and interesting.


Thank you for being part of my lecture and completing the task!
My comments:
Nice work, but on the first task you missed to give your point of view on this method.
Also, in the chart, I can see several reaccumulation and redistribution periods that you didn't point out. As well as that, I believe that the analysis could have been a bit more developed!
Overall score:
5/10
Thank you for your valuable feedback.