Trading strategy with the VWAP indicator - Crypto Academy/S5W3 - Homework post for @lenonmc21
Hello Everyone,
It is yet another week of lessons on crypto in the SteemitCryptoAcademy. Professor @sachin08 introduces us to trading with Wedge Pattern in this week's lesson. I will attempt to tackle the questions in the homework task to the best of my ability. Hope you enjoy reading my post

VWAP is an acronym for Volume-Weighted Average Price. The words, Volume, and Price in its name indicate that its calculation has something to do with the price and volume of an asset.
VWAP indicator gives an accurate average price of a traded asset throughout a day, thus it is best adopted for intraday trading. Information on the daily price average is important because it gives traders fair knowledge about the value of an asset. Traders can identify the market trend of an asset just by observing the position and direction of the VWAP line and comparing it to previous timeframes.
As touched on in the lecture, another unique feature of the VWAP indicator is that the value remains the same regardless of the selected timeframe in a day. This gives traders a more confident stand to take trades efficiently. When a price is moving below the VWAP line, is it clear that the asset is trading below its average value so traders will go for a long position with the view that the price will move upward to recover its average value. The same phenomenon is applied by sellers when the price is trending below the VWAP line.
VWAP indicator also helps in trend confirmation. When an asset crosses above or below the VWAP line with high volumes, it is a sure indication that buyers or sellers are dominating the market and that the price of an asset is expected to continue in the current trend for a while. Traders can also determine whether they bought an asset at a cheap price or expensive price when compared to the VWAP value.
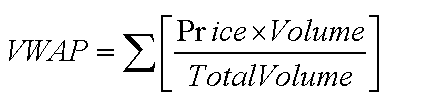
How to Calculate VWAP
Volume -Weighted Average Price is calculated by adding the traded price for every transaction multiplied by the amount of volume traded. The resulting value is then divided by the total amount of volume in the market
Formula :
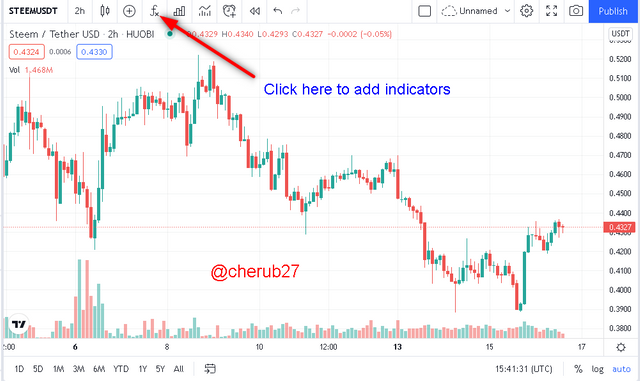
- Visit any chart menu on TradingView and click the indicator button as shown in the screenshot below.
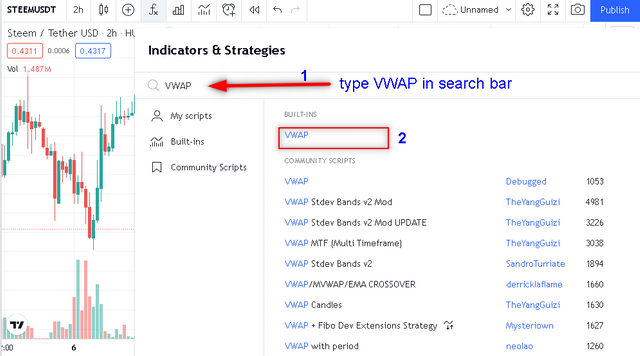
- Type VWAP into the search bar and select it from the options provided. The indicator will be applied once selected. Close the menu.
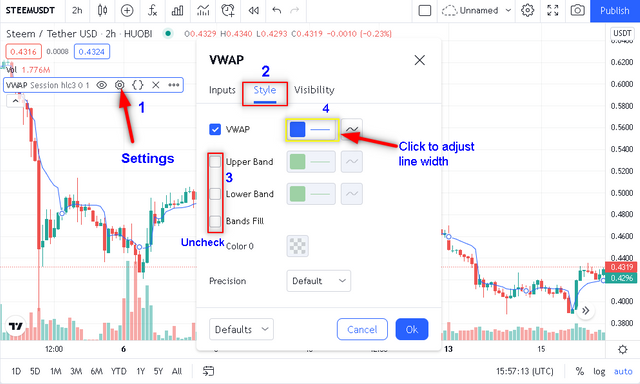
- Click on the Settings button for the indicator and navigate to Style. Uncheck the box for Upper band, Lower band and Bands fill and close the menu to save the setting. Again, click on the VWAP color box and adjust the line width to a more visible one.
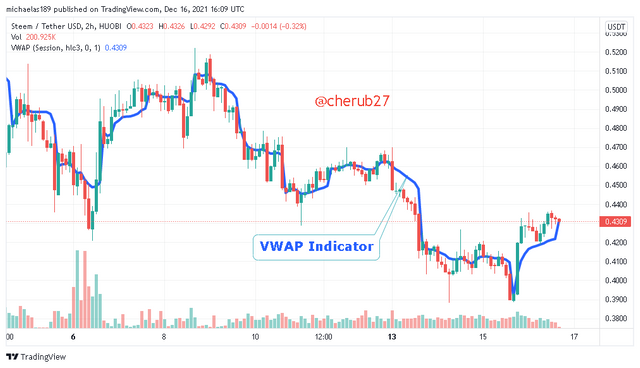
- VWAP indicator successfully added
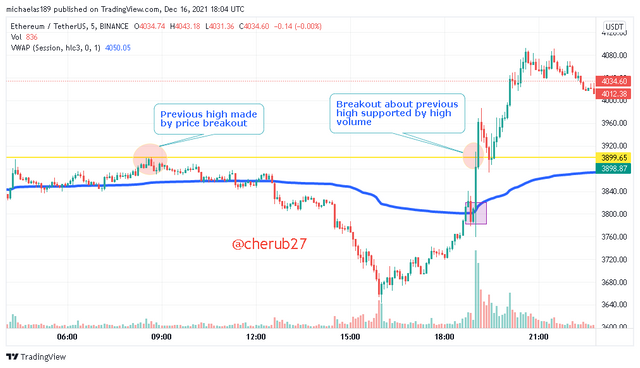
- Determine the breakout trend
The first step after applying the VWAP indicator is to mark out the trend. This is done by marking out a breakout that surpasses the previous high or low value. For a bullish trend, take notice of the previous high and wait till the price breaks the VWAP line and surpasses the previous high price. The same applies to bearish trends where you wait till the price breaks the previous low after a clear breakout of the VWAP line.
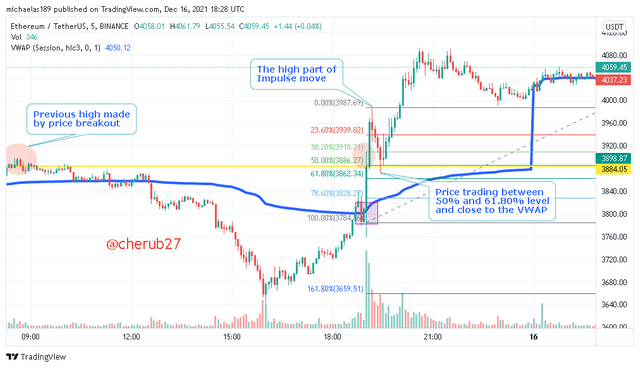
- Monitor Price Retracement to VWAP line
The next step is to wait and observe as the price hits a new high and retraces back to the VWAP line. Here, we can make use of the Fibonacci retracement tool. Place a Fibonacci grid from low to high for bullish trends and high to low in bearish trends. Monitor the price till it trades between the 50% and 61.8% levels. Taking an entry between this zone is optimal for the strategy with the VWAP indicator.
- Managing Risks
We should look to take entry within the 50% and 61.8% zone and set a stop-loss just beneath the 61.8% level. Take profit should be 1.5 times more than the stop-loss, managing a risk profit ratio of 1-1.5 to 1-2 at most for less risk-averse traders.
The trade entry and exit criteria requires four strategies that are crucial in ensuring that one properly enters a trade and take maximum profit with minimal loss. The strategies include:
Waiting for the price to break the previous minimum or maximum. Traders are no to consider any trade with the VWAP indicator until the previous high price for uptrend or low price for a downtrend is surpassed after the a breakout at the VWAP is observed. Wait until the previous maximum or minimum is broken before you consider using the VWAP strategy.
Wait for price retracement to 50%-61.8% zone of Fibonacci tool for correct entry. Once the previous high or low is broken, we should expect a price retest. The impulse move is bound to retrace back to the VWAP line at some point in time. Using the Fibonacci retracement tool will help take a better entry price. We must wait for the price to be in confluence with the VWAP line and trading between the 50%-61.8% zone before we take entry.
Managing risks with a correct Stop-loss price Inorder to take a trade with a good risk to reward ratio, the stop-loss must be set below the 61.8% level to safeguard against price turnaround and minimise losses.
Profit taking should be in at least a 1:1.5 or maximum of 1:2 ratio with our Stop-loss target. A profit target which is 1.5 times the stop-loss target is recommended.
To properly trade VWAP indicator for entry and exit, it is worthy to stick to all the strategies listed above to be at an advantage on such trades.
PRACTICE
1. Make 2 entries (One bullish and one bearish), using the strategy with the “VWAP” indicator. These entries must be made in a demo account, keep in mind that it is not enough just to place the images of the entry, you must place additional images to observe their development in order to be correctly evaluated.
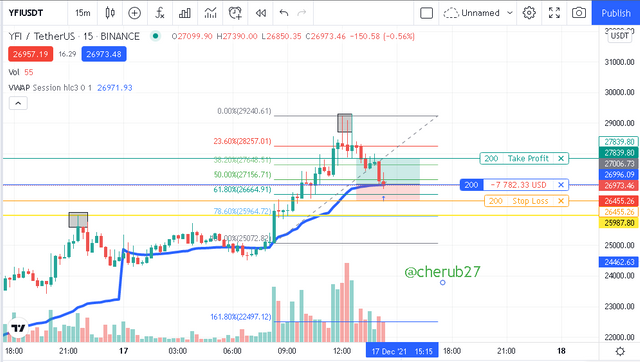
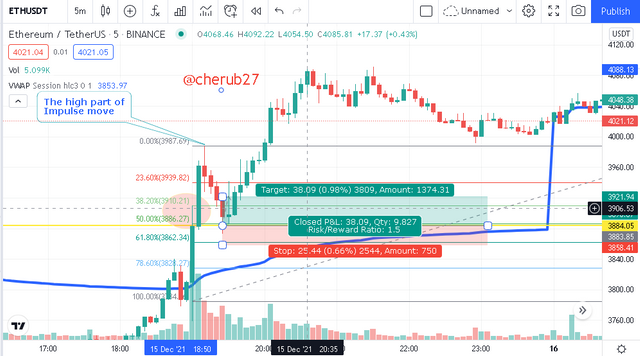
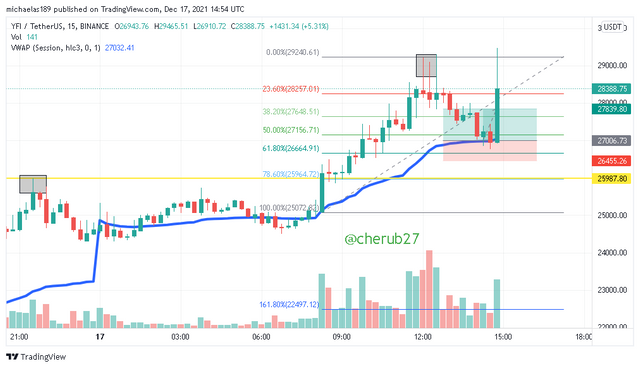
I came across a bullish YFI/USDT chart that had achieved some of the criteria. After waiting for all the criteria to play out, I decided to enter a long position when the price retrace to 50% to 61.8% zone . Entry target just below 50% Fib level, with stop loss just below 61.8% Fib level. Take profit target was set at a 1:1.5 risk to reward ratio.
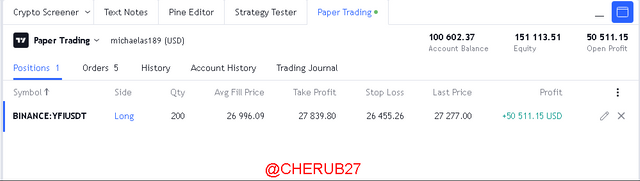
I allowed the order to place out for a while and the result at the end of the trade is presented below.
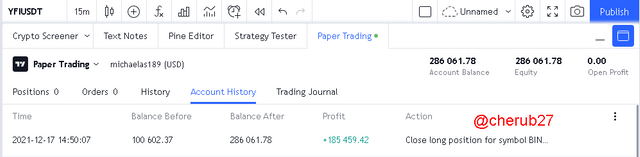
The screenshot below show the profit made from the buy order of YFI/USDT.
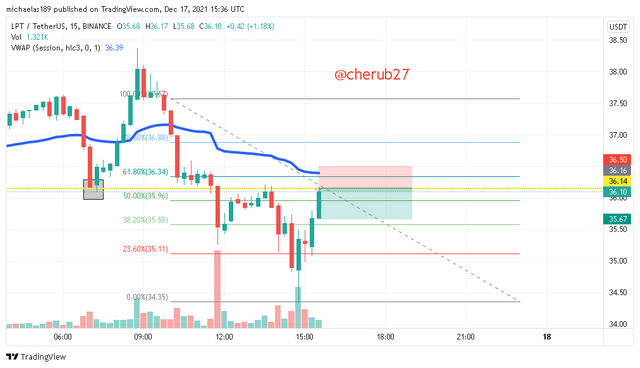
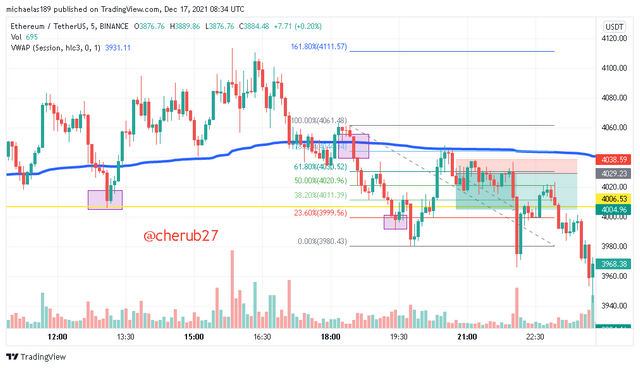
I came across a bearish LPT/USDT chart that had achieved some of the criteria. After waiting for all the criteria to play out, I decided to enter a short position when the price retrace to 50% to 61.8% zone . I placed my entry target exactly between the 50% to 61.8% zone , with stop loss above the 61.8% Fib level. Take profit target was set at a 1:2 risk to reward ratio.
My stoploss was triggered just about 15mins after I had placed the trade as the asset price continued to rise instead of retracing.
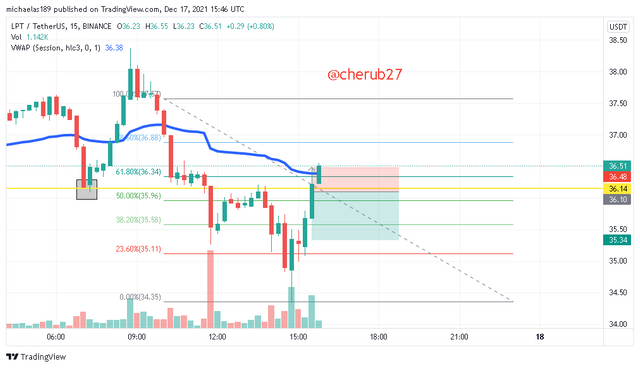
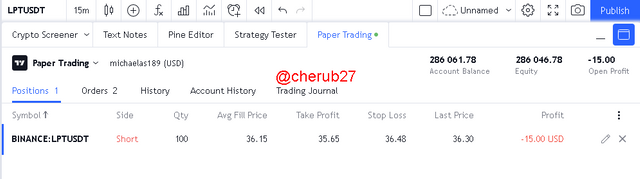
The screenshot below show the loss made from the sell order on LPT/USDT
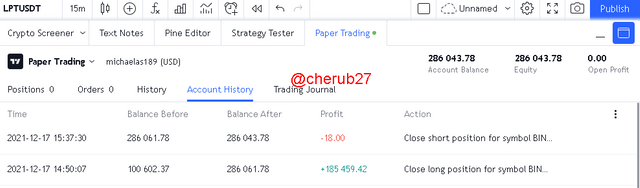
Though I incurred a loss on the LPT/usdt short trade, I made massive profit on the YFI/USDT long trade which is quite impressive.
The combination of the VWAP indicator and Fibonnaci Retractment tool is a perfect strategy which provides entry, stoploss and take profit targets for traders who apply the strategy correctly.
Thanks to professor @lenonmc21 to the introduction to this trading strategy
You have really explained to my understanding.
Thanks.
Glad I could be of help
🤗🤗🤗