Crypto Academy Week 16 - Homework Post for [@Fendit]-- The Wyckoff Method

The Composite Man
Richard Wyckoff substitutes smart investors and whales for the concept of the composite man. The composite man is revered as a single entity that manipulates the market to accumulate profit at the expense of other maker takers. He somehow controls the market trend and holds in his scheme of making a profit.
”…all the fluctuations in the market and all the various stocks should be studied as if they were the result of one man’s operations. Let us call him the Composite Man, who, in theory, sits behind the scenes and manipulates the stocks to your disadvantage if you do not understand the game as he plays it; and to your great profit if you do understand it.”
Richard Wyckoff
Trade Cycle of Composite Man Concept
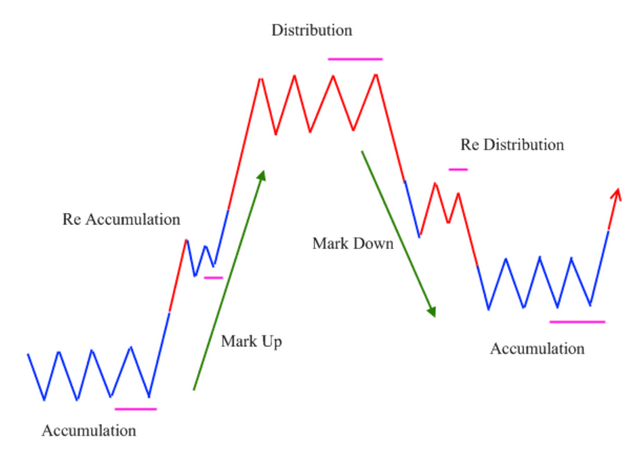
Accumulation
The composite man finds an asset at a price that he likes and starts to invest by slowly buying more of that asset. They do so in a way that no alarm is raised through significant price stimulation. Though there would be a significant increase in market volume as the composite man buys more assets in parts to avoid suspicion.Uptrend
Once enough asset has been accumulated, the composite man entices other investors to join in on the market and start to drive the price up. Here, demand becomes high as more people troop into the spiking market causing a significant increase. There is a period of re-accumulation as the market tries to adjust to the instant price spike before the bullish run resumes.Distribution phase
At this phase, there's no longer enough supply to meet the market demand, resulting in a high price of assets.
Once the market reaches a price where the composite man is satisfied with profit accumulation, he starts selling his accumulated assets little by little.
He starts selling just enough not to cause a down surge but enough to get rid of his position as fast as possible and avoid suspicion.Downtrend
Once the composite man succeeds in selling off all his position, the lack of volume in the market causes the market to spiral downwards as supply now becomes greater than demand. Other investors also sell off their position to the late market takers. The bearish run continues until another short period of re-accumulation where the market tries to adjust to the sharp price drop before continuing its bear run.
It is worth not that, the volume of the market decreases as the price increases. This is because the composite man sells of his position little by little with each price surge to exist his position and acquire enough profit without raising an alarm
The Fundamental Laws of Wyckoff
- Law of Supply and Demand
The law of supply and demand is a basic concept in economics which lays out the trend of a market. There are 3 clear parameters when it comes to supply and demand.
- When Demand exceeds Supply, price of asset rises
- When Demand equals Supply, price of asset remains constant
- When Supply exceeds Demand, price of asset drops
During the Uptrend phase, it is observed that the price of the asset rises as more investors jump in on the market, increasing the demand.
The phenomenon of demand = supply is observed in the Distribution phase as the asset price reaches its peak. Here, the rate of buying and selling balances out and the asset experiences insignificant price changes.
During the Downward phase, it is observed that the price of asset decreases. Here, investors sell their position, freeing up their held assets. This results in increased supply over demand
- Law of Cause and Effect
This law reminds of me Newton's 3rd law of motion which states that 'Action and reaction are equal but opposite'
In this instance, to every effect, there is an underlying cause regardless of the impact .
It happens that the variation in supply and demand is influenced by certain actions accompanied by their respective effects.
It is observed that, the accumulation of asset by investors eventually led to the incidence of uptrend. Here, accumulation is the cause which resulted in uptrend(effect). Same happens in the distribution phase where investors sell their positions. Distribution becomes the cause which leads to Downtrend(effect)
- Law of Effort vs Result
It is understandable that the trading volume at a particular time influences the market price of an asset. A significant change in volume results in a significant price movement. Here, the change in volume is regarded as the effort which results to change in price.
For instance, if a market has high trading volume, there is indication of high support when can predict the price of the asset raising and vice-versa.
It is worth to note that High volumes indicates big effort and Sideways movements indicates small efforts
Myckoff Method of Analysis on A Chart
For this analysis, I have chosen to use the 2h chart trade of DOGE/USDT from May 14, 2021. I have marked all the phases in the first screenshot and further elaborated on the phases with 2 more screenshots.
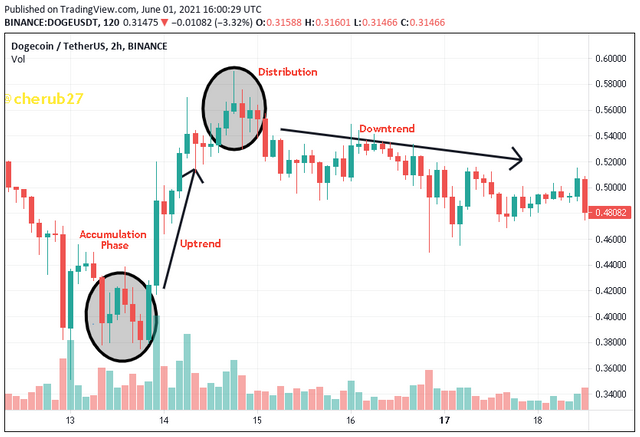
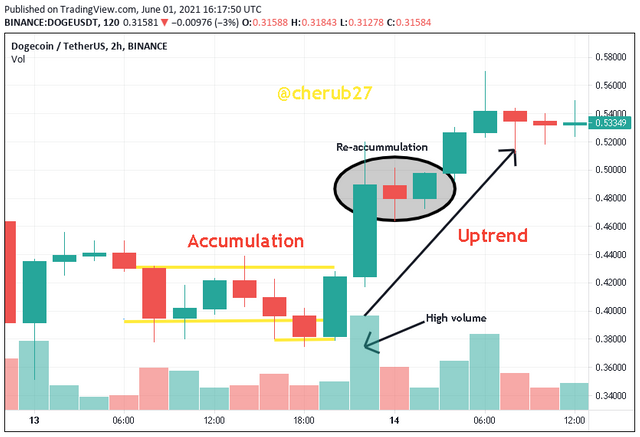
- Accumulation
There is no significant change in price as the volume goes sideways which indicates small effort.
The composite man would accumulate asset here and manipulate the market to dip below the resistance so other holders will sell out their position due to emotions. The composite man takes advantage and buys the freed assets and incites an uptrend.
- Uptrend
There is a spike in volume which corresponds to increase in market price. The uptrend undergoes a re-accumulation to handle the sudden price surge before continuing. This is indication of people entering the market causing demand to exceed supply.
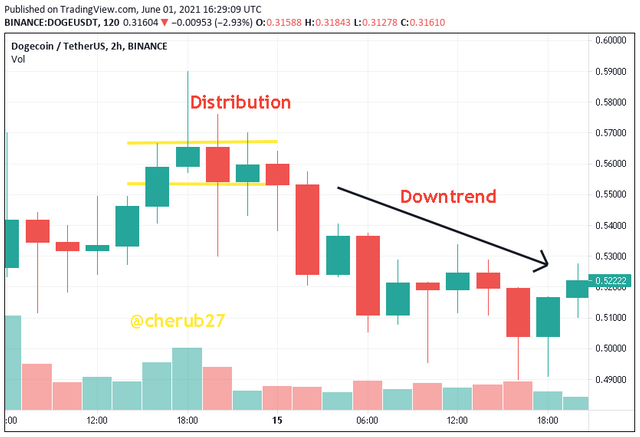
- Distribution
The price has reached its peak as supply meets demand. The volume spike a bit and then moves sideways in the chart. Investors start to sell their position here.
- Downtrend
Price starts to falls with a couple of re-distribution phases. This indicates that supply exceeds demand and is characterized by decreasing market volume
Conclusion
Although Wyckoff Method is one of the oldest technique, it is still valid as it helps investors make rational trade void of emotions. Investors are encourage to has a basis but they jump into a market.
It is necessary to determine the trend and strength of the asset. It is most suitable when the asset follows the market trend. Once that is established, find out if the asset is likey to move and pick up an appropriate time to enter the market after careful analysis of the market.
I am grateful to @fendit for introducing this subject matter to us. It really give you the mindset to think like huge investors do and go for profits just like they do. I really enjoyed analysing charts to fish out Myckoof Trends which has enlightened me more on the subject matter.
Thank you for your attention
@fendit
Thank you for being part of my lecture and completing the task!
My comments:
Your answers were really good and your work was really nicely presented! I appreciate that!
When it comes to the chart, the phases were correct, but I wish you had developed a bit more your analysis!
Overall score:
6/10
Alright professor @fendit. Thanks for the review. I'll develop more on the analysis next time