Crypto Trading With Alligator Indicator - Crypto Academy /S5W3-Homework Post for kouba01
Introduction.

Image designed by me on Snappa
Discuss your understanding of the use of the Alligator indicator and show how it is calculated?
The Alligator indicator which is used in technical analysis of a assets in the market was created by a market phycologist called Bill Williams in the year of 1995.
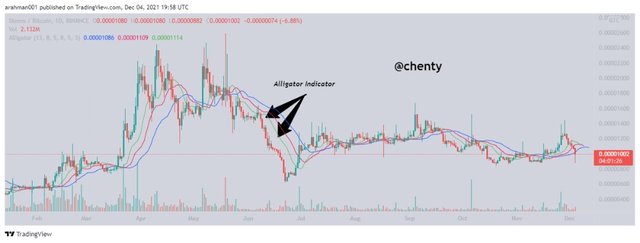
The Alligator indicator was created purposely to determine the behavior of assets in the market and to help interpret its meaning. The name of this indicator came from the real life behavior of the animal called alligator. It is notice that this animal uses most of its time to rest and wakes up very active to find food.
 STEEM/BTC chart from TradingView
The behavior of this animal was then compared to the natural behavior of the assets in the market. Most of the times the assets move in a steady motion and after a while it either moves in an uptrend or downtrend and hence the creation of the alligator indicator.
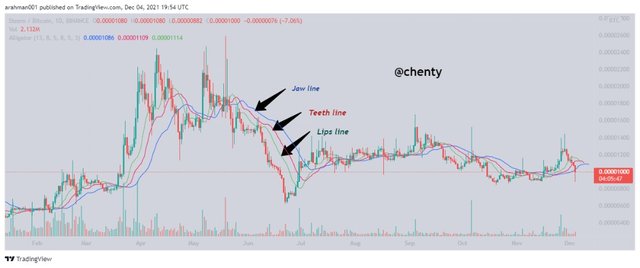
Alligator indicator consists of three smooth moving average lines, and each line is different from the other by a color difference. The lines were named as; Jaw line (Blue color), Teeth line (Red color) and the Lip line (Green color).
 STEEM/BTC chart from TradingView
The image above shows the three different lines of the Alligator indicator. The Jaw line (Blue) with Adjustments and period of 13 and 8 respectively, the Teeth line (Red) with adjustments and periods of 5 and 8 respectively and then the Lip line (Green) with adjustments and period of 3 and 5 respectively.
These three lines come together to make a meaningful idea of the indicator, as to whether the asset is in uptrend, downtrend or in a stable state.
Calculations of the Alligator Indicator
MEDIAN PRICE = (HIGH + LOW) / 2
JAW LINE = SMMA (MEDIAN PRICE, 13, 8)
TEETH LINE = SMMA (MEDIAN PRICE, 8, 5)
LIPS LINE = SMMA (MEDIAN PRICE, 5, 3)
Where;
MEDIAN PRICE — median price of a candlestick
HIGH — the highest price of the candlestick bar
LOW — the lowest price of the candlestick bar
SMMA — Smoothed Moving Average.

Show how to add the indicator to the chart, How to configure the Alligator indicator and is it advisable to change its default settings?
How to add Alligator indicator to a chart.
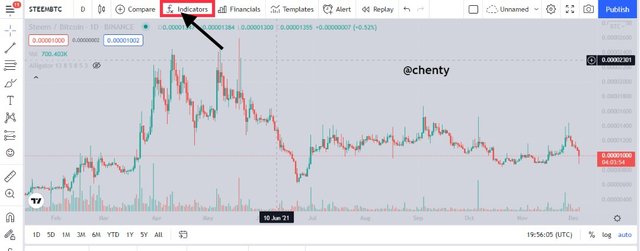
- First of all, visit the TradingView platform and choose your preferred crypto pair to make the analysis using alligator indicator.
Click on the Fx Indicator
 STEEM/BTC chart from TradingView
- A pop up menu will appear, search and select the William Alligator indicator to apply to the chart.
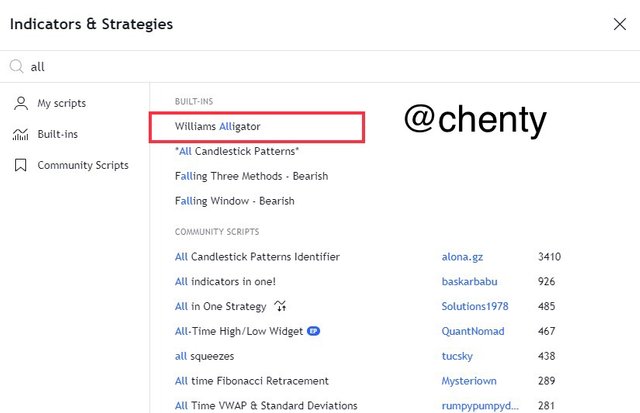 Image from TradingView
- After applying the indicator to the chart, the three lines of the chart appears. To configure, click on the settings icon.
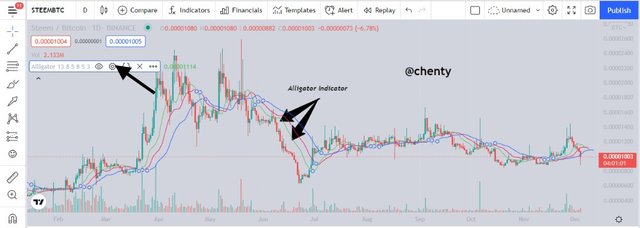 STEEM/BTC chart from TradingView
- From the menu of settings, it is grouped into input, style and visibility. In the input section, you can configure the indicator with regards to its periods and adjustments values.
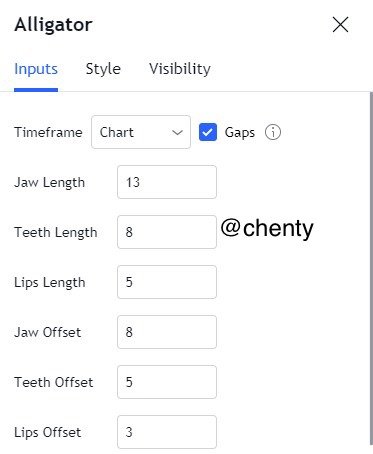 Image from TradingView
- And from the the style section, you can configure the indicator in terms of the colors and thickness of the lines.
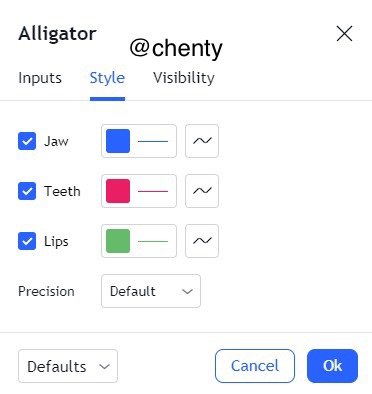 Image from TradingView
- Lastly the visibility section helps to reduce the noise around the indicator in order produce more accurate results of the indicator.
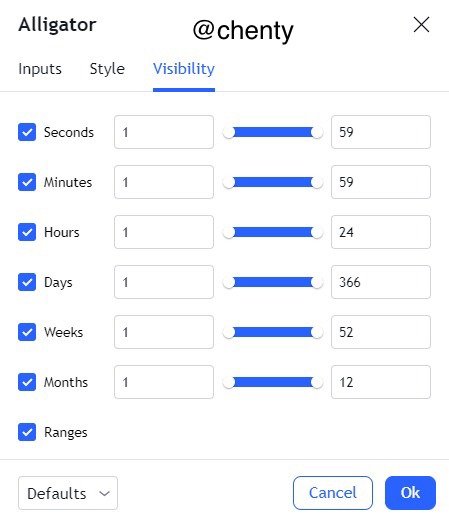 Image from TradingView

Is it advisable to change its default setting?_______
From my experience in the use of many indicators, I see it advisable to leave the settings of indicators at its default. My reason is that, any change in the input of the indicator may alter the outcome of that particular indicator. Also the creation of the alligator indicator was made in its best suitable form and so I see no use in changing its default settings.
Also, from my time of using the alligator indicator, I find it a bit complex and so changing the input default settings may become difficult for me to use in technical analysis.
Many experts who are familiar with the alligator indicator may try to adjust the settings to their satisfaction. And in general the part of its settings I think may be adjusted without causing error in the use of the indicator is the style section since it has nothing to do with the general input of the indicator.

How do we interpret this indicator from its 3 phases: the period of rest(or sleep), awakening, and the meal phase?
As already mentioned earlier, the alligator indicator is similar to that of a real life animal alligator. It’s interpretation is done with the three phases it undergoes.
The phases are divided into three namely; the rest/sleeping period, Awakening Phase and the meal phase. I will now explain what happens in each of these phases.
The Rest/Sleep Phase
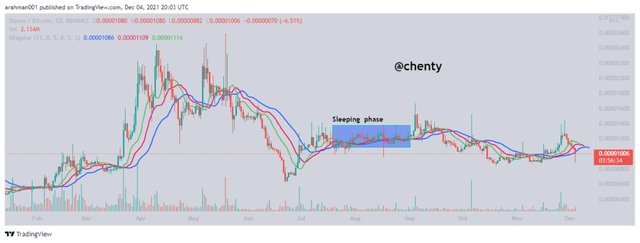
This period/phase is considered rest period because, it behaves in a similar way of the alligator when it is resting. The Alligator is not active and therefore no search for food, consequently causing the resting of the three lines.
 STEEM/BTC chart from TradingView
The chart above clearly shows the period of rest of an asset in the market when the alligator indicator is applied. The chart can be linked to the real life animal. Meaning, the current state of the asset is steady and it is not trending.
To explain further, the asset behavior moves in a sideways and causes an almost stable price of the asset. It should be noted that, the asset does not move in either uptrend or downtrend. When the asset is in this state, there will surely be a breakout in the movement of the chart after the resting period is over. The market trend may shift to uptrend of downtrend after the sleeping face, hence requires careful observation.
The Awakening Phase
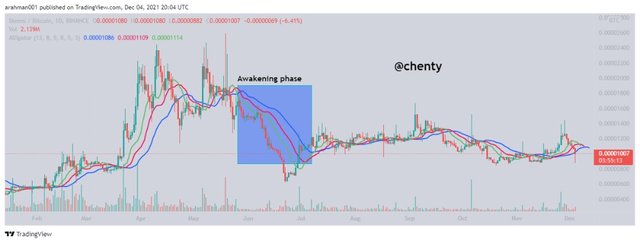
This is the period where the alligator has just woken up from sleep and it can be compared with the alligator indicator. In this state, the indicator will now look to breakout causing a trend in the market. It should also be noted that longer sleeping period may also cause a very strong trend breakout in either direction of the market.
 STEEM/BTC chart from TradingView
The trend breakout now shows the activeness of the alligator indicator and hence creates a market entry for buyers. The trend that appears after the sleeping period may either be a bullish trend or bearish trend. The trend that will be formed usually determined by the arrangements of the Alligator indicator lines.
When the the lips line falls below the jaw line, the market is considered to be in a downtrend and when the lips line falls above the jaw line, the market is considered to be in uptrend.
The Meal Phase
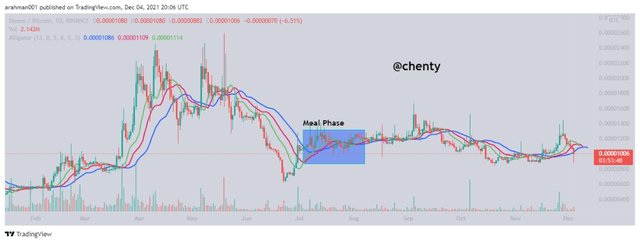
The final stage of the alligator indicator is the meal stage which describes in real life the phase where the animal finally gets the food into its mouth. When market trend is short, the alligator indicator goes to rest and when the trend is long it may shift to another position.
 STEEM/BTC chart from TradingView
This stage of the alligator indicator is what I refer to as the exit or holding stage. After the market is trending, there may be trend reversal in the asset price, hence causing an exit in the market or even entry in the market. If there is a case that the alligator goes back to sleep, many investors may decide to hold on to their assets.
But if there is a trend reversal, investors may exit the trade to take out their profits and reduce their losses.

Based on the layout of its three moving averages that make up the Alligator indicator, how can one predict whether the trend will be bullish or bearish.
It is no news that the main purpose of the alligator indicator is to predict the market trends of assets in the market. With the Alligator indicator, it makes it simple to predict the market trend of an asset.
As already mentioned earlier, it possible to predict the market trend of an asset by observing the arrangements of the three lines of the alligator indicator. Also the three phases of the alligator accounts for the trend prediction.
Trend prediction for Bullish
 STEEM/BTC chart from TradingView
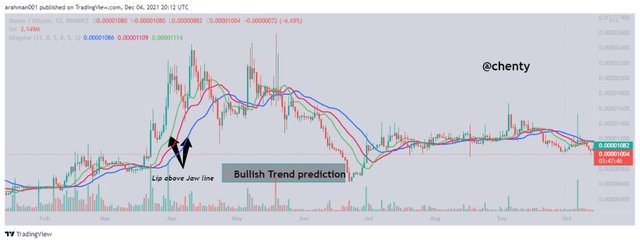
When the market is trending in bullish, the lips(green line) of the alligator is always above that of the jaw line (blue line). For that, it can be confirmed that the market is in a bullish trend if there is no error in the indicator. This is why it is necessary to confirm the results of the alligator indicator with another indicator.
Trend prediction for Bearish
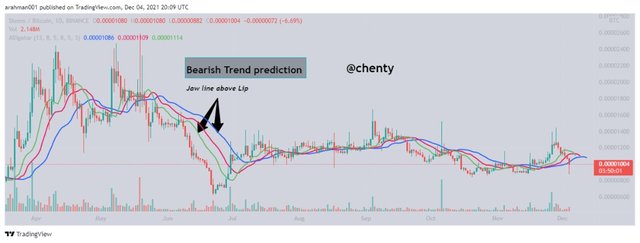 STEEM/BTC chart from TradingView
When the market is trending in bearish, the jaw(blue line) of the alligator is always above that of the lip line (green line). For that, it can be confirmed that the market is in a bullish trend if there is no error in the indicator. This is why it is necessary to confirm the results of the alligator indicator with another indicator.

Explain how the Alligator indicator is also used to understand sell / buy signals, by analyzing its different movements.
Since the alligator indicator can be used to determine/predict market trend, then it can also be used to determine buy/sell signals in the market. This also comes from the observation of the arrangements of the lines of the alligator indicator.
The buy signal is usually predicted when the market is shifting to a bullish trend. Meaning, when the lip (green line) places itself above the jaw (blue) line. It is necessary to confirm this observation with other indicators or wait for a while before making a buy order.
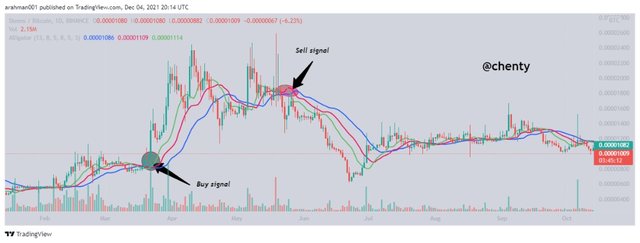 STEEM/BTC chart from TradingView
Meanwhile the sell signal is directly opposite to the buy signal and it is determined when the market is in bearish trend. As a result the jaw (blue) line of the indicator places itself above the lip (green) line of the indicator.
Another major action required when using this indicator is to set up stop losses and take profits in order to minimize losses and increase profits.
_

Do you see the effectiveness of using the Alligator indicator in scalping trading style? Explain this based on a clear example.
Scalping trading is style of trading where by the timeframe for trading occurs at very short intervals. For example traders may decide to trade within a period of minutes or seconds.
From my experience of using the Alligator indicator, I have found out that it works very nicely when the time frame are set a shorter interval. For example when I set the timeframe to 5 minutes, I usually get more accurate results.
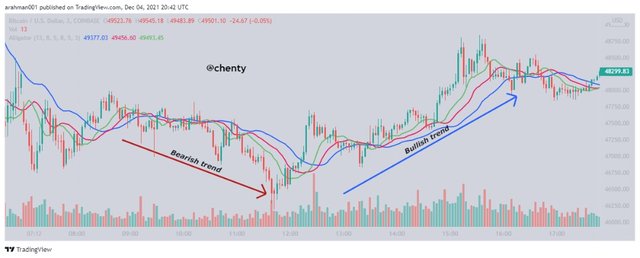 BTC/USD chart from TradingView
This type of trading style works perfectly with the alligator indicator when the market volatility is very high. With the usage of the Alligator indicator, it clearly indicates when the market is in a bullish or bearish trend and hence helps many traders to identify good entry and exit positions in the market.
So from my knowledge and experience, the alligator indicator works effectively with scalping trading style and works even more effectively when there is confirmation with the use of other indicators.

Is it necessary to add another indicator in order for the indicator to work better as a filter and help get rid of unnecessary and false signals?
Yes It is always necessary to combine two or more indicators when performing technical analysis in order to produce more accurate results since no indicator can be 100% accurate. Also there may be some errors that occur when 1 indicator is used and can cause a wrong signal.
Therefore it is necessary to add another indicator to that of the alligator indicator to produce more accurate and reliable results from technical analysis.
With this said, I have decided to combine the alligator and RSI indicator in order to produce a more reliable result in technical analysis. After applying the RSI indicator with the alligator indicator, the results from both indicators can then be compared and when there is a match, we can now make a market decision.
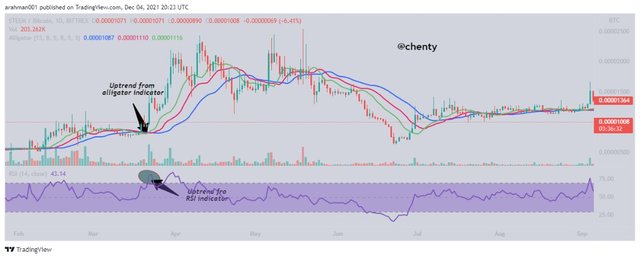 STEEM/BTC chart from TradingView
Since I don’t have much knowledge in technical analysis I usually don’t change the settings of an indicator after applying it to a chart. Therefore I left the RSI input values at its default so I can perform my analysis.
When the market is in bullish trend, the the RSI value rises above 80 and the line breaks away from the small box of the RSI indicator. This then confirms the bullish prediction of the alligator indicator. And when the RSI value falls below 20, it breaks down the rectangle box of the RSI indicator showing a bearish trend.
All these helps as to make good market entry and exit positions so as to increase our profits and reduce losses.
_

List the advantages and disadvantages of the Alligator indicator.
Every indicator comes with its special benefits and may also have some flaws it encounters. In this part, I will be analyzing the advantages and disadvantages of the Alligator indicator.
Advantages
It is very easy to use and reading the results of the indicator is very simple too. Market trend prediction with the alligator indicator is very easy and it helps traders to discover good entry and exit positions.
The alligator indicator works alternately well with other indicators. For example when I used it with the RSI indicator, the results were much more accurate and reliable.
Disadvantages
From my observation, the alligator indicator tends to show trend signals at a slower rate. The signals are not predicted early enough and these may cause traders to miss out on bullish trend.
In short, aside some few false signals it shows the signals late.
_

Conclusion.
The alligator indicator has proven to be very useful indicator in technical analysis. It helps traders to observe bullish and bearish trends. This as a result, helps traders to discover market entry and market exit positions. But it should be noted that this indicator can not be 100 percent reliable just as the other indicators.
It very necessary to add other indicators with the alligator indicator in order to produce more reliable results from the analysis.
One flaw I have noticed from this indicator is that, it sometimes provides late signals which may cause trades to miss out in trading good times.
Thank you.
Upvoted! Thank you for supporting witness @jswit.
