Steemit Crypto Academy Season 3- Dynamic Course for Beginners - Week 3 | All about Trends, Supports and Resistances and simple chart patterns. Lecture Professor @lenonmc21. Homework by @charis20
Good day Steemians, I welcome you back to my blog. Today i come with my Homework on Dynamic Course for Beginners. This course is indeed dynamic.
Question 1
Define in your own words what is a "Trend" and trend lines and what is their role in charts?
Answer
Trend
In my understanding, the trend in cryptocurrency trading is when price moves in a particular way for a long time without alterations. This could be in positive or negative direction. The positive direction movement can be seen as the bullish trend while the nagetive direction can be seen as the bearish. This movement stays for a while. During the positive movement most traders make their profits in a short while while in the negative direction some traders expecially those that are coming into the market newly. It is very important to study trends properly, this will help an investor to know when to trade. Also not trading is also trading because you are doing a study at that point to allow you as a trader to understand what the market looks like.
- Trend Line
In cryptocurrency trading trend line connects 2 or more price points on a chart, the continues to a feature way. This scan be in a high and high directon or in a low and low direction. A trend line is a direction giver that any investor that follows it properly will really make mistakes in his investment. Trends can last for a long time like say upto a month or more. Presently most coins are on the decrease for the past 2 weeks and from all indication it will stay for a while.
Question 2
Explain how to draw an uptrend line and a downtrend line(show a screenshot of each)
- Uptrend Line
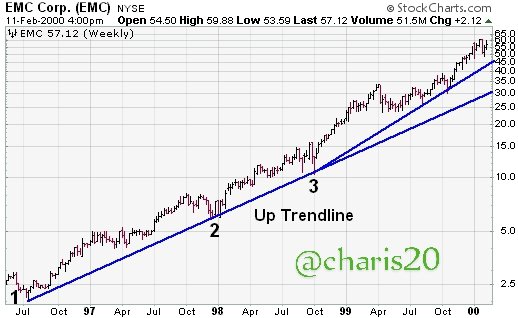
An uptrend line has a positive incline and is framed by associating at least two depressed spots. The subsequent low should be higher than the first for the line to have a positive slant. Note that something like three focuses should be associated before the line is viewed as a substantial pattern line.
Uptrend lines go about as help and demonstrate that the net (request less stockpile) is expanding even as the value rises. A rising cost joined with expanding requests is extremely bullish, and shows a solid assurance concerning the purchasers. However long costs stay over the pattern line, the uptrend is viewed as strong and flawless. A break beneath the uptrend line demonstrates that net-request has debilitated and an adjustment of pattern could be inevitable.
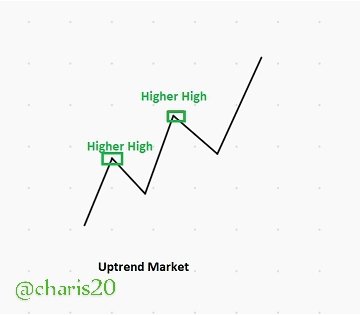
Simply put, the uptrend uses the bullish pattern, that is a higher high price track.
Uptrend
3 dots joint uptrend
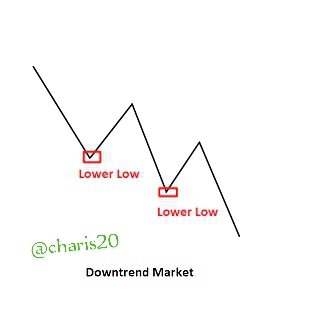
Downtrend
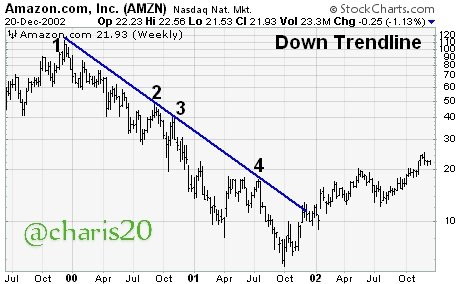
Downtrend lines go about as obstruction and demonstrate that net (supply less interest) is expanding even as the value decreases. A declining cost joined with expanding supply is exceptionally negative, and shows the solid determination of the merchants. However long costs stay underneath the downtrend line, the downtrend is strong and flawless. A break over the downtrend line shows that net supply is diminishing and that a difference in pattern could be approaching.
As uptrend connects two or more price points that moves towardsthe same direction so also downtrends connects more than two stock price that moves in the same direction.
Downtrend
3 dots connected downtrend
[Source](https://school.stockcharts.com/doku.php?id=chart_analysis:trend_lines
Question 3
Define in your own words what "Supports and Resistances are and how we can identify both zones (Show a screenshot of each one).
Answer
- Supports
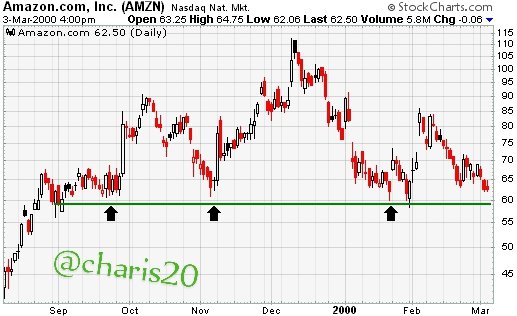
In this case demanding is so strong to the point that it will prevent the current market price from reducing further. Investors at this time are willing to buy at that set market price but the traders are nit willing to sell. By the time it reaches the set support, the demand will automatically over shot supply. This will prethe pricefrom going below the support price.
Supports
Resistance
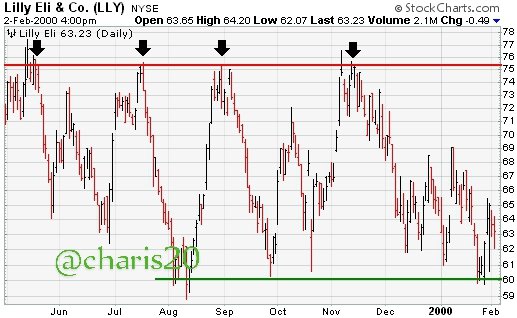
In the resistance, the price is too strong to stop the price from going up. At this point the traders are more ready to sell but the investors are not willing to buy. At the point the price gets to resistance level, supply will overgrow demand and that will prevent the price from going up any longer.
Resistance
How we can identify both support and resistance zones
Distinguishing proof of key help and obstruction levels is a fundamental fixing to effective specialized examination. Despite the fact that it is once in a while hard to build up definite help and obstruction levels, monitoring their reality and area can extraordinarily upgrade investigation and anticipating capacities. On the off chance that a security is moving toward a significant help level, it can fill in as an alarm to be extra watchful in searching for indications of expanded purchasing pressure and a likely inversion. On the off chance that a security is moving toward an opposition level, it can go about as an alarm to search for indications of expanded selling pressing factor and expected inversion. In the event that a help or obstruction level is broken, it flags that the connection among market interest has changed. An opposition breakout flags that the bulls (request) have acquired the high ground and a help break flags that the bears (supply) have won the fight.
Question 4
Explain in your own words at least 2 simple chart patterns with screenshots.
The uplifting news is you don't really have to have a lot of cryptos exchanging experience to have the option to detect these examples. Indeed, various simple to-plot graph designs are broadly utilized by brokers, all things considered, to recognize where costs may be going straightaway.
Some Patterns include
- Triple and twofold tops and bottoms
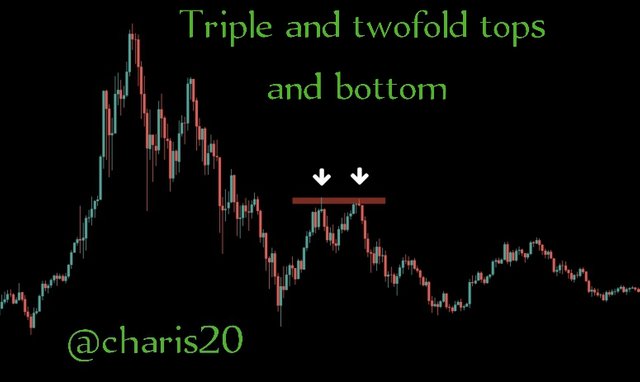
Triple or twofold top and base diagram designs are by and large what they sound like; when costs ricochet off a similar opposition (top) or backing level (base) a few times successively.
Both triple and twofold examples are inversion arrangements and regular signal costs are going to head the other way. A twofold top, for example, is the point at which a crypto resource is in an upturn and costs meet a solid opposition region. During the principal visit, costs bob off it and break lower briefly before rapidly ascending back up. Upon the second visit to a similar opposition level, costs are constrained down a lot more grounded than previously and another downtrend starts.
If costs break over the opposition or beneath the help anytime, the example is viewed as refuted and a value continuation will probably happen rather than an inversion.
Triple and twofold tops and bottoms
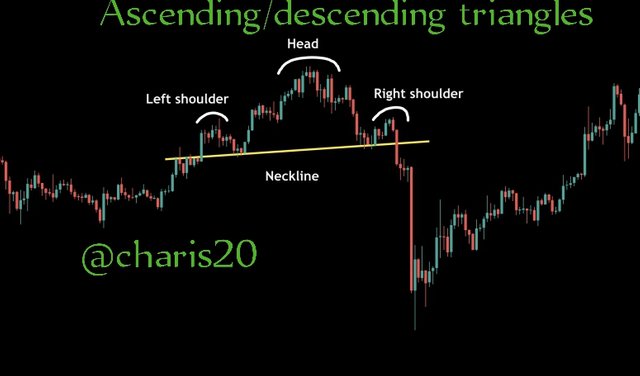
- Ascending/descending triangles
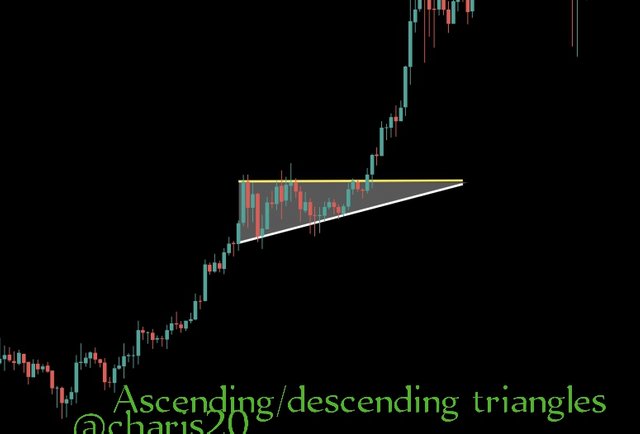
Ascending/descending triangles are known as continuation diagram designs (bullish and negative, separately). A ascending triangle, for instance, comprises of a level line interfacing the new value highs and a corner to corner line associating the greater cost lows.
These seem when bullish brokers get dismissed at a similar opposition level on various events however retreat less after each endeavor until in the end, the value gets through.
Ascending/descending triangles
- Climbing/plunging triangles
Rising and dropping triangles are known as continuation outline designs (bullish and negative, separately). A rising triangle, for instance, comprises of a level line associating the new value highs and a slanting line interfacing the greater cost lows.
These seem when bullish merchants get dismissed at a similar opposition level on numerous events yet retreat less after each endeavor until at last, the value gets through. The equivalent goes for diving designs, where merchants ultimately conquer a base help after various pushbacks and costs proceed with lower.
Ascending/descending triangles
Conclusion
Understanding trends and trendlines is very important. As professor @lenonmc21 said during his lectures that " trend is our friend". So we need to do an indept study about this trend so that we will be on the safe side while trading.
Thank you so much Professor @lenonmc21for your sacrifice towards this lecture, also to the assistant lecturer Professor @awesononso for taking time to go over this work. Thank you @steemitblog for this opportunity to learn about cryptocurrency trading.
Best Regards
@charis20
Thank you so much professor for your kind analysis. I have taken all correction to account.