Crypto Trading Strategy with Triple Exponential Moving Average (TEMA) indicator - Crypto Academy / S6W2 - Homework Post for @fredquantum.
Hi great steemian, it's nice doing this task for season 6 Week 2 under professor @fredquantum

Image with imarkup

QUESTION 1
What is your understanding of Triple Exponential Moving Average (TEMA)?

Image with imarkup
The Triple Exponential Moving Average is an improvement on existing Moving Averages that addresses their shortcomings. Patrick Mulloy developed this concept to improve and eliminate the lagging aspect of existing Moving Averages, as well as the price noise that obscures their signals.
Moving averages have long been regarded as one of the most straightforward indicators in the trading world, suitable for both novice and experienced traders. Simple moving averages, exponential moving averages, and weighted moving averages are examples of these types of moving averages.
It's a trend-following technical indicator that calculates its value using three exponential moving averages (EMAs), which filters and smooth the signals it generates in comparison to other indicators. It has also been observed to use two TEMA to read some of its signals, such as making buy and sell positions and employing the crossover trading strategy.
The TEMA works by using a smoothing function that is generated during the calculation process. This function ensures that the indicator ignores lags and random price fluctuations, yielding a smoothed representation of the indicator data in relation to price movement. As a result, when using the average indicator to identify trends, trend structure, support, and resistance areas, the TEMA is the best option.
The following are the characteristics of the Triple Moving Average:
- It can be used to spot obvious trends as well as trend reversals.
- It can also be used to locate zones of support and resistance.
- Through the crosses below two TEMA indicators of different periods, the Triple Exponential Moving Average (TEMA) can be used to identify buy and sell zones.
- The angled slope of the TEMA indicator's oscillating line represents trend directions. A bullish trend can be easily identified by the indicator line's upward angle slope and price movement that is above the TEMA indicator line. *A bearish trend can be identified by the indicator line's downward angle slope and price movement staying below the TEMA indicator line.
QUESTION 2
How is TEMA calculated? Add TEMA to the crypto chart and explain its settings. (Screenshots required).
TEMA Calculation
The calculation of the triple exponential moving average (TEMA) is represented by a mathematical expression. The expressions are as follows:
TEMA = (3 EMA1) - (3 EMA2) EMA3 TEMA = (3 EMA1) - (3 EMA2) EMA3
Where;
EMA1 = Exponential moving average
EMA2 = EMA of EMA1
EMA3 = EMA of EMA2
From this formula, the calculation is made up of three EMAs, each with the same period, ensuring that the EMA data obtained is consistent. The TEMA also uses a repeating coefficient of 3 in its EMA 1 and 2, ensuring that the TEMA indicator's product values are smoothed over the specified period.
How to Add TEMA on the Chart
Start the trading view website by logging in
Using the toolbar's indicator icon
To add the TEMA indicator to the chart, look for it and click it
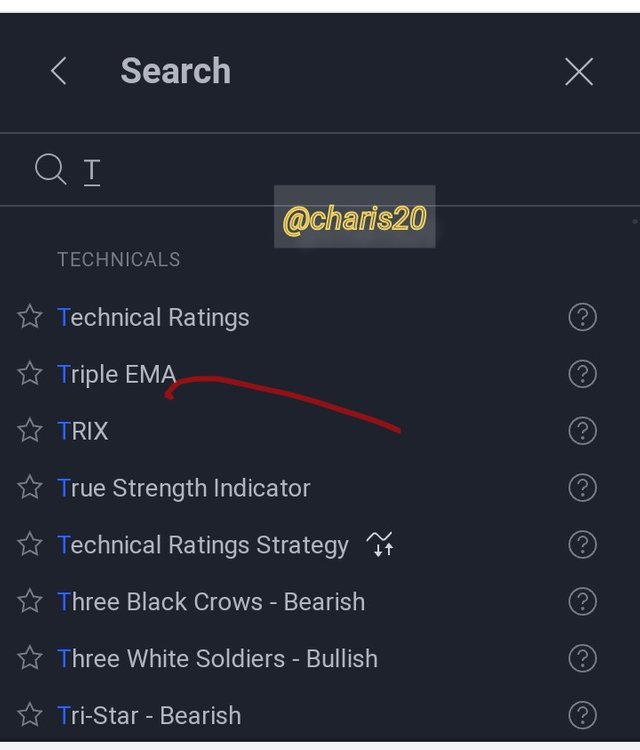
Image with imarkup
Settings
I used the indicator's tap button for setting in order to adjust the length from 9 to 25 even the style to what i like.
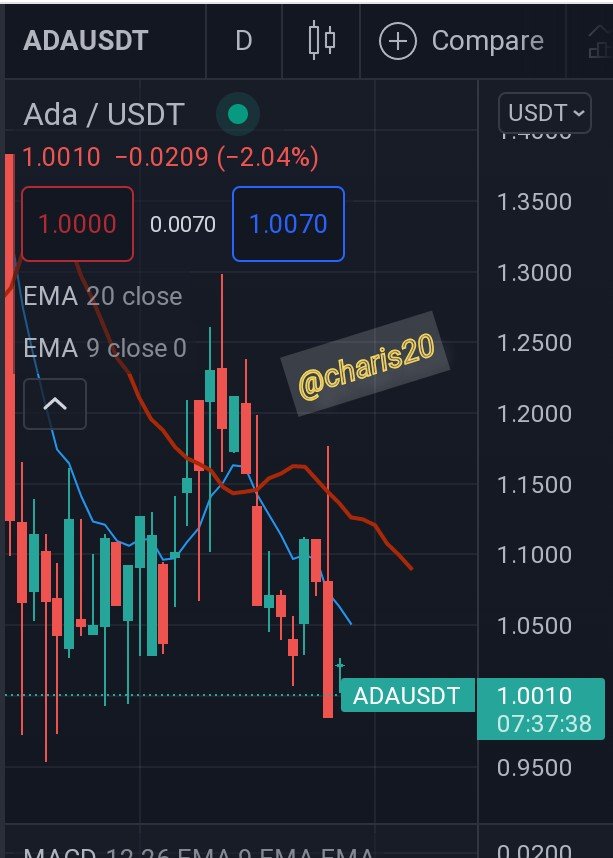
Image with imarkup
The longer the time duration, the easier it is to notice price changes. Increase the time period to 25 to get a more accurate picture of price changes.
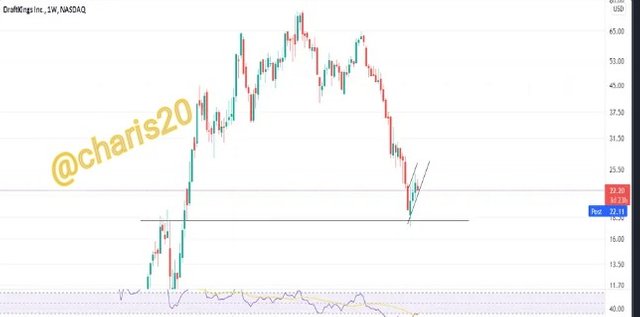
Image with imarkup
QUESTION 3
Compare TEMA with other Moving Averages. You can use one or two Moving Averages for in-depth comparison with TEMA.
TEMA was created to eliminate the lag that other types of moving averages have, making it a more efficient and reliable trend indicator. The TEMA indicator is a type of moving average that closely follows price movement and predicts trends, trend reversals, support, and resistance levels faster than other types of moving averages.
In comparison to other moving averages such as the SMA and EMA, TEMA produces a more precise and smoother signal.
The TEMA is a trend-following indicator that reacts faster to price changes than the SMA and EMA because the lag factor is subtracted when calculating its averages.
Moving Averages have evolved in various forms, with the goal of bringing an important trading tool closer to the needs of traders. In its attempt to provide a solution, the system inadvertently creates one.
The SMA calculates its average price value over a given period using the simple arithmetic mean, whereas the EMA calculates its average price value using or emphasizing recent price values. The TEMA calculates the average value of its market price using three (3) EMA values.
Because of its relative quickness to price changes, the TEMA is a more efficient and complete moving average than other types of moving averages.
QUESTION 4
Explain the Trend Identification/Confirmation in both bearish and bullish trends with TEMA (Use separate charts). Explain Support & Resistance with TEMA (On separate charts). (Screenshots required).
Trend Identification Using TEMA
Moving Averages are trend-following technical indicators, and so TEMA, which is more developed in this regard, monitors price trends more quickly. This gives you a much better idea of where the trend lines are during the trade.
The TEMA indicator identifies a trend by moving the indicator line in the same direction as the labeled trend. The angle of the indicator line reveals the current trend as well as possible price changes, allowing traders to take advantage of trading opportunities.
Trends in a Bullish Scenario
A trend-following indicator, the TEMA indicator can be used to set the future of a financial asset. To begin with the bullish trend, we can see a bullish trend when both the prices and the TEMA Indicator angles are pointing upward.
We by now know that a bullish trend is one that moves in an upward direction. Before we can say this in the TEMA scenario, we must have noticed that the price trend is above the TEMA line. As a result, we can say there is an uptrend or a bullish trend scenario whenever a trend is seen above the TEMA indicator line.
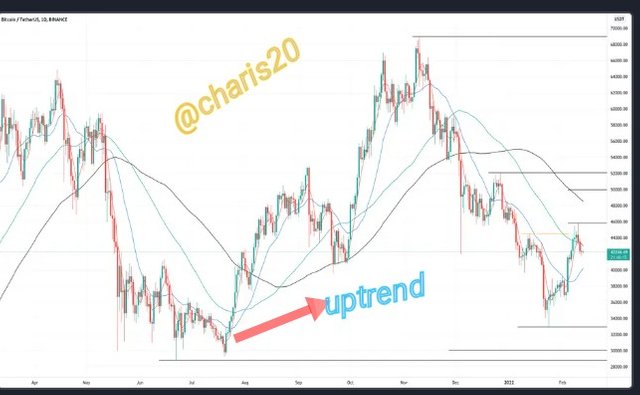
Image with imarkup
Trends in a Bearish Scenario
With the angle of its line moving downwards in the same direction as price movement, the TEMA Indicator identifies a bearish trend.
We must have observed that the price trend is below the TEMA line before we can say trends are in a Bearish state scenario. As a result, we can say there is a downtrend or a bullish trend scenario whenever a trend is seen below the TEMA indicator line.
In all of this, the TEMA line and the price trend are in a downward trend.
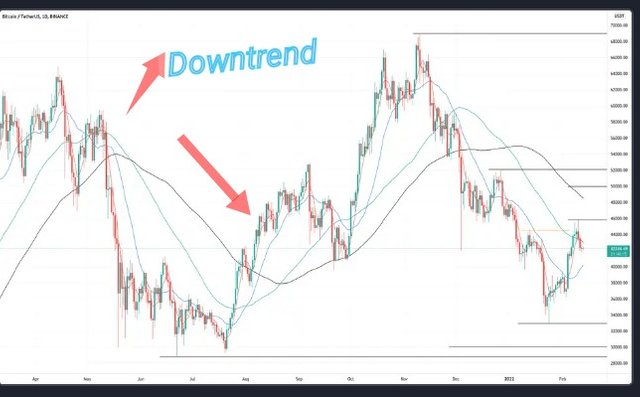
Image with imarkup
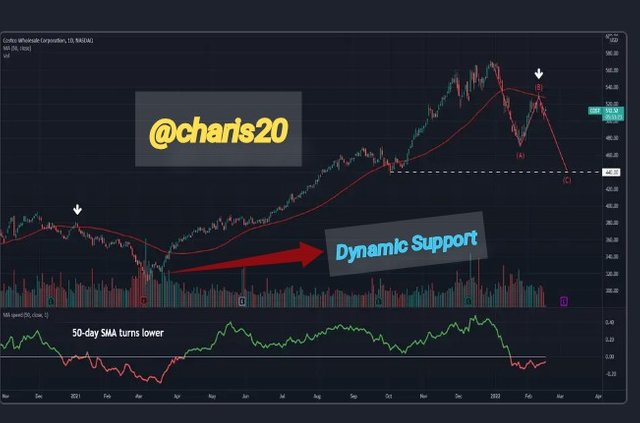
TEMA Support and Resistance
High price zones with a lot of buying and selling activity are typically used as support and resistance levels. At this point, the price trend is retesting the indicator line's close. These retests or pullbacks are typically seen in these areas and are trade signals for trend reversals, which can be bullish or bearish.
In contrast to other types of moving averages, which serve as dynamic resistance to price movement in a downtrend, the TEMA indicator serves as dynamic support. When the price approaches the dynamic support (TEMA line), it rejects it, indicating a potential trend reversal, i.e. from bearish to bullish. The TEMA also suggests a potential trading opportunity, such as selling after a pullback if the TEMA indicator line is rejected by price.
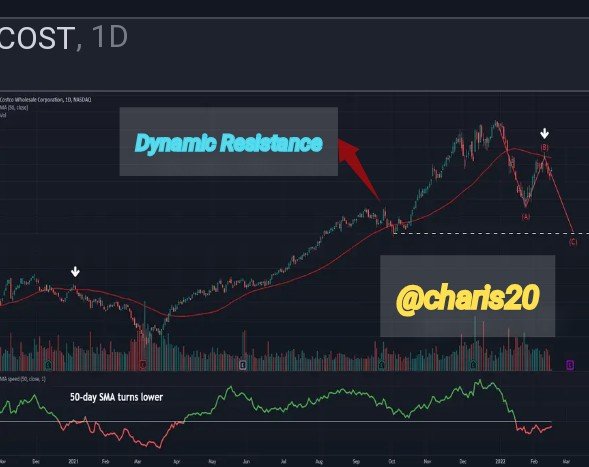
Unlike other types of moving averages, which serve as dynamic support to price movement in an uptrend, the TEMA indicator serves as dynamic resistance to price movement in an uptrend.When price comes close to dynamic resistance (TEMA line), it rejects it, indicating a possible bullish to bearish trend reversal. The TEMA also suggests a possible trading opportunity, such as buying after a pullback if the TEMA indicator line is rejected by price.
In an Uptrend Scenario, which happens to be our Resistance level, both the price trend and the TEMA indicator line are pointing upwards, but at this resistance point, the TEMA indicator line is above the price trend line, signaling a trend reversal in the reverse way. In this case, we should always anticipate a downward trend reversal.
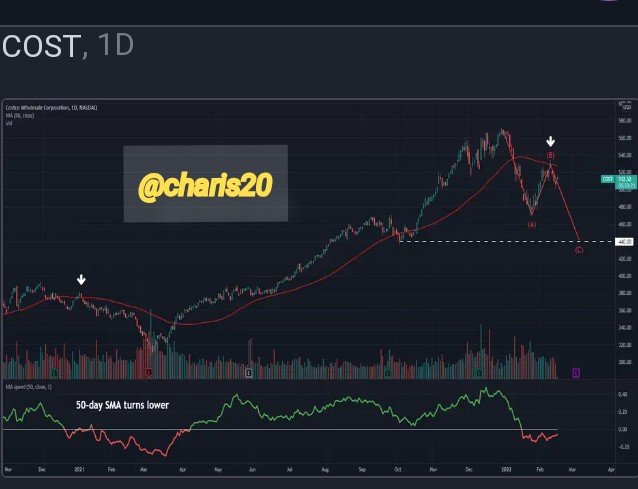
In a Downtrend Scenario, which happens to be our Support level, the price trend and TEMA indicator line are both pointing downward, but the TEMA indicator line is below the price trend line at this support point, reversing the trend in the opposite direction. In this case, we should always anticipate an upward trend reversal.
Image with imarkup
Trading view.com
QUESTION 5
Explain the combination of two TEMAs at different periods and several signals that can be extracted from it. Note: Use another period combination other than the one used in the lecture, explain your choice of the period. (Screenshots required).
Combining Two TEMA is a trading strategy that makes use of two TEMA indicators with different period settings, one with a shorter period and the other with a longer period.In theory, a TEMA indicator set to a limited timeframe reacts to trading activity faster than one set to a longer period.
When we see the shorter period TEMA crossing over the longer period, we know we're looking at an uptrend in price direction. The shorter period settings would be set to 30 in this scenario, while the longer period settings would be set to 65. As a result, we should expect the 25 TEMA to cross above the 50 TEMA. In a nutshell, the price trend rises when the shorter period TEMA is greater than the longer period TEMA.
Trading view.com
In a similar scenario, the Longer TEMA-65 could cross above the shorter period TEMA 30 or the shorter period TEMA could find itself below the longer period TEMA. In this case, we should expect a downward price trend. In a nutshell, the price trend falls if the shorter period TEMA is lower than the longer period TEMA.
Trading view.com
QUESTION 6
What are the Trade Entry and Exit criteria using TEMA? Explain with Charts. (Screenshots required).
Trade Entry and Exit for a Buy Order
I'll be using the two TEMA indicators, the 20 and the 40 TEMA, for the trade demonstration, as I mentioned earlier. With that choice:
I'll start by adding the TEMAs 20 and 40 to my chart.
Because I'm looking for a buy entry, the current trend should be a downtrend, as indicated by prices below the indicators.
After the crossing of the 20 TEMA above the 40 TEMA with at least two candlestick formations, we place a buy order.
Setting a stop loss below the crossover, or preferably below the last swing low point, and a take profit to a risk-to-reward ratio of 1:1 to 1:2 is the trade exit.
Trading view.com
Trade Entry and Exit for a Sell Order
I'll be using the same two TEMA indicators as before, which are the 20 and 40 TEMA. With that decision made, I'll proceed with the procedures outlined below:
I'll start by adding the TEMAs 20 and 40 to my chart.
Trading view.com
The current trend should be up, as indicated by prices above the indicators because I'm looking for a sell entry.
After the 20 TEMA crosses below the 40 TEMA with at least two candlestick formations, we place a sell order.
Setting a stop loss above the crossover, or preferably above the previous swing's high point, and a take profit to a risk-to-reward ratio of 1:1 to 1:2 is the trade exit.
Trading view.com
QUESTION 7
Use an indicator of choice in addition with crossovers between two TEMAs to place at least one demo trade and a real margin trade on an exchange (as little as $1 would do). Ideally, buy and sell positions (Apply proper trade management). Use only 5 - 15 mins time frame. (Screenshots required).
The Relative Strength Index (RSI) is a technical indicator that shows whether a market is overbought, oversold, or balanced. The RSI levels of 30 and 70 are used for this. When the price falls below the 30 RSI level, the market is considered oversold and a possible bullish reversal signal is present. A move above the 70 RSI level indicates that the market is overbought and may be preparing for a bearish reversal.
To use the RSI and TEMA together, the two indicators must meet the criteria for a crossover and the corresponding market conditions state.
Trading view.com
This is a 3min time frame for the BTC/USDT pair. The signals from the TEMA and RSI indicators are used to create a sell setup.
The longer period TEMA-65 was found to be higher than the shorter period TEMA-30, indicating a downward trend in asset price. The RSI indicator agreed with this bear trend, confirming the position of a sell setup.
QUESTION 8
What are the advantages and disadvantages of TEMA?
Advantages of TEMA Indicator
Following the development of price movement, the TEMA also identifies dynamic support and resistance levels. This aids traders in identifying trading entry and exit points.
With its crossover strategy, the TEMA identifies buying and selling opportunities by combining two TEMAs with different periods to generate a trade signal.
Because of the lag reduction based on its calculation, the TEMA indicator is related to price changes faster than other types of moving averages. This ensures that trade opportunities are taken advantage of as soon as possible.
It is a leading indicator which provides signals well ahead of time.
Disadvantages of the TEMA
During times of market volatility or choppy trading, the TEMA tends to provide few signals, resulting in false signals.
We noticed that the TEMA reduces lag to the bare minimum; however, some investors prefer a lagging indicator to keep track of more significant market effects.
Because of the TEMA's concept, it appears to react to price changes faster than the SMA. This makes it difficult to ignore insignificant effects because it would react to every market push.

Image with imarkup
CONCLUSION
The TEMA can be used to identify trends as well as levels of support and resistance. We can also use the various crosses in the use of higher and lower periods to find entry and exit points.
TEMA works by using a straightening function that is generated during the calculation process. This function ensures that the indicator ignores lags and random price volatility, yielding a smoothed representation of the indicator data in relation to price movement.
My appreciation goes to professor @fredquantum for this course. God bless you