Steemit Crypto Academy Season 3 Week 2 - Beginner's Course | Introduction to Charts for @reminiscence01
Hello everyone, I’m excited to the take part of this lecture of professor @reminiscence01. The lecture was on the topic Introduction to Charts. The detailed explanation of our respected professor has made me understand charts very well and I’m ready to participate in this assignment.

1. Explain the Japanese Candlestick Chart? (Chart screenshot required)
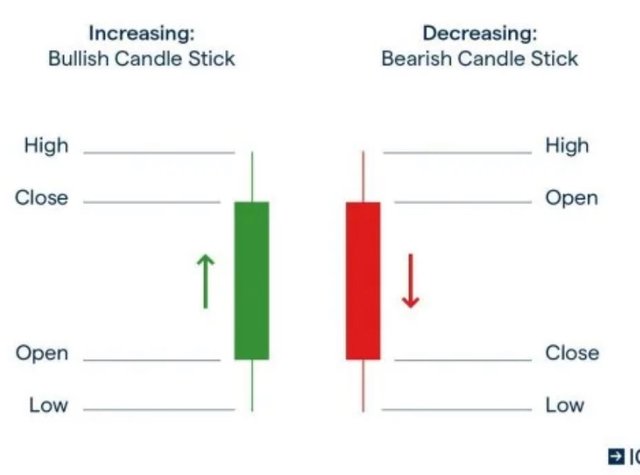
The Candlestick is a type of chart is used in analyzing and predicting the high, low, closing and open of prices of a product for a specific period. It was introduced by Japanese rice merchants long ago, before been modified by western traders.
The Japanese candlestick is made up of two “bars”. The red candle and the green candle.
The green candle is bullish showing an increase in price, whilst the red candle is bearish showing a decrease in price. The larger intersection of the candle is known as the real body.
This body shows the opening and closing prices. For the bullish candle, the bottom of the real body shows the opening price whilst the top shows the closing price. But for the bearish candle, the top shows the opening price while the down shows the closing price.
The lines above and below the body are called shadow, tail or wick. These show the highest and lowest prices of the products.
When a price move is positive, it is indicated by a green or white candlestick body but when a price moves negatively, it is indicated by a red or black candlestick. The color is determined by the choice of the trader.
Screenshot: source

2. Describe any other two types of charts? (Screenshot required)
Bar chart
A bar chart represents the prices with bars. It is the most understandable and clear bar you can think of. The opening, highest, lowest, and closing prices for each time period are represented by each plotted bar.
This bar in the above picture was plotted on a chart with the prices on the vertical axis and year range on the horizontal axis. The smaller times such as hours and minutes can also be represented on the bar chart. The range is the difference between the highest and the lowest bar.
Bar charts are ideal for comparing the prices of two or more currencies or products over time.

Line chart
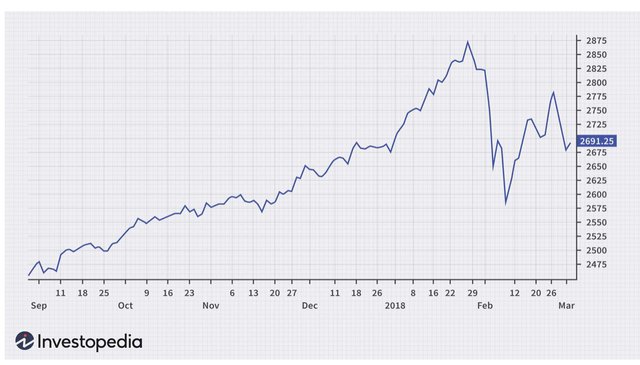
This line chart is used to display data of cryptocurrencies as series of makers connected by a straight line. It is used to show information that changed over time. Several points are created and joined together by a straight line to form the line chart.
The graph above was drawn with date on the horizontal axis and the change in prices on the vertical axis.
3. In your own words, explain why the Japanese Candlestick chart is mostly used by traders.
There are so many reasons why people prefer the Japanese candlestick. Some of these reasons are highlighted below:
- Most traders use the Japanese candlestick because they can determine the state of the market at a glance. Traders can determine the state of the market by simply looking at the color of the candlestick. They can also predict with the length of the candlestick.
When the candlestick is becoming bullish, they know the market is strengthening and on the other hand when it is becoming bearish, they know the market is weakening.
- Traders see the direction of the market more easily. On the Japanese candlestick, the color and shape of the candlestick can make traders know whether the upward movement is part of the bullish or its just a bearish movement.
- Helps in determining market patterns very fast. The movement of the market is easily identifiable on the candlestick as compared to another charts. So traders will always prefer this easy root to predict the pattern of a cryptocurrency.
- The Japanese candlestick gives more detailed information about the change in the market as compared to the Bar chart. The show the graphical representation of supply and demand that moves the market over time.

4: Describe a bullish candle and a bearish candle identifying its anatomy? (Screenshot is required)
Bullish Candlestick
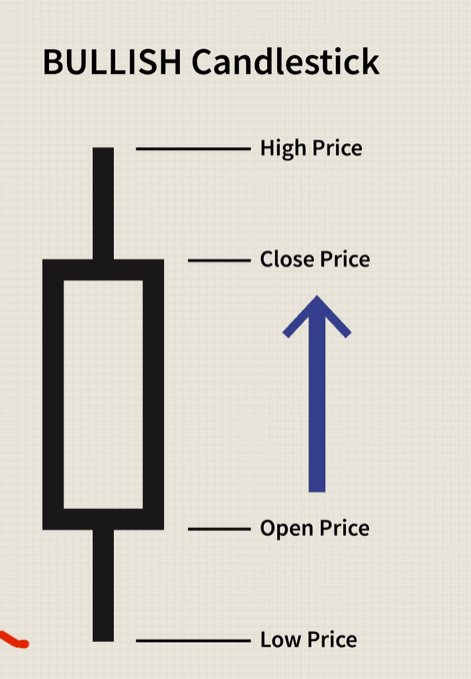
A candle is called bullish when the close is higher than the open. This candle is usually green or white. The bullish candle consist of the opening price, closing price, high and low which indicates the worth of prices on a day. The color of the candle shows whether the closing or the opening is higher. Traders can use these candlestick to determine change in price on minute bases and even up to monthly basis.
Other bullish patterns that can be used to confirm other means of analysis include; momentum oscillators, trend lines or volume indicators. When there is a decline in prices, bullish patterns may signal a reversal of price.
Bearish Candlestick
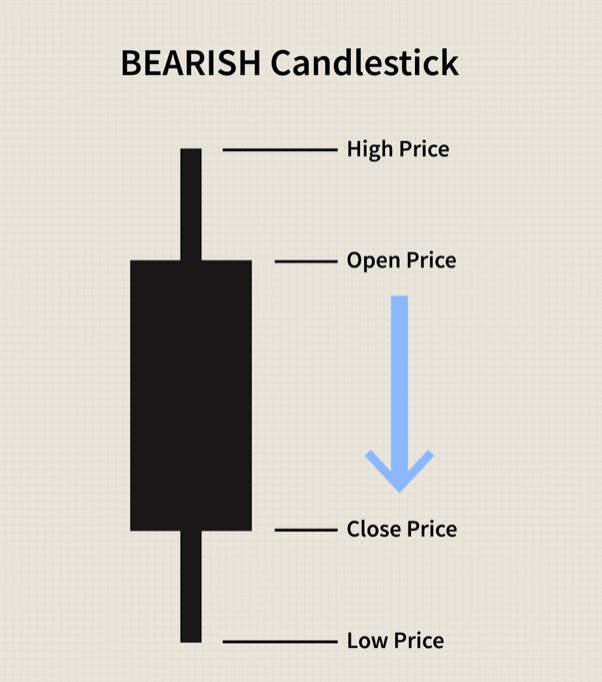
In a situation where the close is lower than the open, it is called the bearish candlestick. The bearish pattern also signals lower prices to come. The anatomy of the bearish candlestick consists of the high price, opening price, closing price and low price. The initial price is often higher than the ending price which shows that the price has fallen.
conclusion
From what we discussed above, it is clearly evident the the Japanese candlestick is a very convenient way of reading the patterns of price changes. The discussion also proved the reason why most traders prefer the Japanese candlestick to the bar charts or line charts
Thank you
Hello @captain36, I’m glad you participated in the 2nd week of the Beginner’s class at the Steemit Crypto Academy. Your grades in this task are as follows:
Observations:
Please remove this image with company name. Use your own chart.
Recommendation / Feedback:
You did great in answering the questions in a simple term. Thank you for participating in this homework task.