Trading With Chaikin Money Flow (CMF) Volume Indicator - Crypto Academy / S4W6 - Homework Post for @kouba01
Edited with canva
INTRODUCTION
The path chosen by professor @kouba01 in spending valuable time educating the Steemit Crypto Academy students and followers on some very important technical indicators to aid their trading ventures is quite appreciable due to the numerous values associated with the decision. This is because, while using price action, market structure and some other personal trading strategies could be very good, implementing one or two technical indicators could be a game-changer when done correctly and appropriately.
While there are different types of indicators, the one being explored for this particular week is an important volume indicator which the professor has stated to have been adjudged to be the best of its kind. Generally, these volume indicators can be quite useful in anticipating price directions since they indicate the shifting momentum of flows in the market. In fulfillment of this week's homework task I am going to be explaining the Chaikin Money Flow (CMF) volume indicator.
1. In your own words, give a simplified explanation of the CMF indicator with an example of how to calculate its value?
A very crucial volume indicator, the Chaikin Money Flow Volume was created in the 1980s by a man called Marc Chaikin. He created the indicator for the purpose of being used to track the zones of accumulation or distribution of an asset in a specified period of time. This indicator is set to work in such a way that it reads values that are between + 1 and -1. Equally, there is a zero (0) mark which when crossed either to the upside or to the downside would be helpful in determining how the Money Flow in the market is changing. Also, this upward or downward crossing of the 0 mark is instrumental in gauging the buying or selling momentum of the asset in the specified period of time.
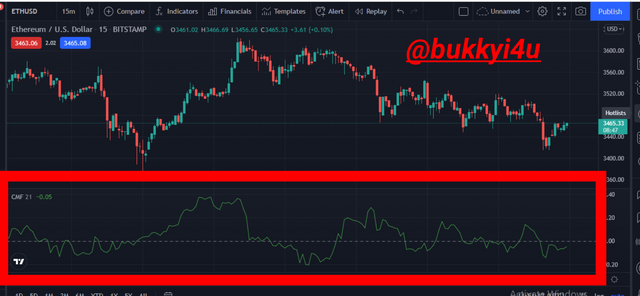
Chaikin Money Flow (CMF) volume indicator
Consequently, when there is buying pressure in the market, positive readings that occur above the zero line are given by the indicator. When selling pressure comes in and it is sustained, the indicator is made to go below the zero line reading negative values. This signals a strong selling pressure in the market. Furthermore, anytime the indicator is seen to be oscillating just around the zero line, it would signify that both buying and selling pressure are relatively occurring at an equal rate. This gives an idea of lack of a clear trend in the market. In the light of the foregoing, the CMF is organised as a system that should help traders to identify trends in the market. More so, it can help the traders to assess and determine the strength of such trends or the level of market momentum behind the trends.
The indicator makes use of volume to weight the average level of accumulation and distribution of an asset in a specified period of time. This indicator works based on the principle which says that if the closing prices are nearer to the highs of the candlesticks, then, more accumulation activities are taking place in the market. On the other hand, if the closing prices are nearer to the lows, then, more distribution activities are taking place in the market. So, the indicator remains positive in a situation whereby the price action is seen to close above the midpoint of the indicator's bar in a consistent manner. Again, it would remain negative if it is observed that the price action closes below the midpoint of the indicator's bar in a consistent manner.
How It Works:-
Generally:-
- The value of the indicator remaining above the zero line usually signifies a lot of strength in the market and if the value should remain below the zero line, it would indicate a lot of weakness in the market
- An effective strategy with the indicator is to always confirm price breakout with the use of resistance and support lines or trend lines. For instance, if price should break through the support level downwards, you should wait for the indicator to read a negative value as a confirmation of the breakout.
- When price marks higher highs as it continues upwards into the overbought region and the indicator falls instead with a lower low, a sell trade can be entered
- A buy trade can be entered if the price action should move lower into the oversold region while the indicator rises instead with a higher high
How To Calculate The Chaikin Money Flow (CMF) Volume Indicator
Normally, in calculating the values for the indicator, three steps are taken; these steps are described below.
1- Money Flow Multiplier
Usually, the first step is to determine the money flow multiplier for each of the periods. This is done in the manner below:
Money Flow Multiplier = [(Close Value - Low Value) - (High Value - Close Value)] / (High Value - Low Value)
2- Money Flow Volume
That will be followed by a calculation of the money flow volume. This is obtained when the volume for the specified period is multiplied by the money flow multiplier from the first calculation. Usually, this is meant to be calculated on a daily basis. However, it could still be figured in such other time frames as hourly or weekly.
Mathematically,
Money Flow Volume = Money Flow Multiplier X Volume for the Period
3- Chaikin Money Flow (CMF)
Lastly, the value for the CMF would be calculated. This is simply the ratio of the money flow calculated daily for the specified period to the sumtotal of the volume for the same specified period of time. By default, the CMF is set to a 21-day period. It is understood that this is meant to represent the trading activity that has occurred over the past month (since in the traditional markets for which the indicator was originally built, a trading month typically consists of 21 to 22 days of trading).
Mathematically:-
CMF = 21-day Daily Money Flow Average / 21-day Volume Average
For the fact that the Chaikin Money Flow indicator is an oscillator, it would be shown on the price chart as a histogram. In most charting platforms and trading softwares, the indicator is already calculated and included. In some platforms it would be divided by 100 pressed in decimal. In some other platforms it could be given values that range between 0 and 100. So, a value of 0.73 on a platform could be represented as 73 on another platform.
Example:-
Calculate the values for the MFM, MFV and CMF assuming the data below was extracted from an asset:
Close price = $178
Low Price = $135
High Price = $201
Volume for the Period = $23,000
21 Period average of volume = $32,000
MFM = [(178 - 135) - (201 - 178)] / (201 - 135)
= (43 - 23) / (201 - 135)
= 20 / 66
= 0.30 (to 2 decimal places)
MFV = 0.30 X $23,000
= $6,900
Chaikin Money Flow = $6,900 / $32,000
= 0.215625
= 0.22 (to 2 decimal places)
This would mean that the asset is in a bullish trend.
2. Demonstrate how to add the indicator to the chart on a platform other than the tradingview, highlighting how to modify the settings of the period(best setting).(screenshot required)
In demonstrating this section I am going to be using KuCoin to add the CMF indicator to the DASH/USDT price chart. However, I would produce other charts with TradingView for the sake of convenience.
To add the indicator to the price chart, I visited KuCoin through their website and logged into my account.
Once on the site, I:
- Clicked on the indicators icon as shown below
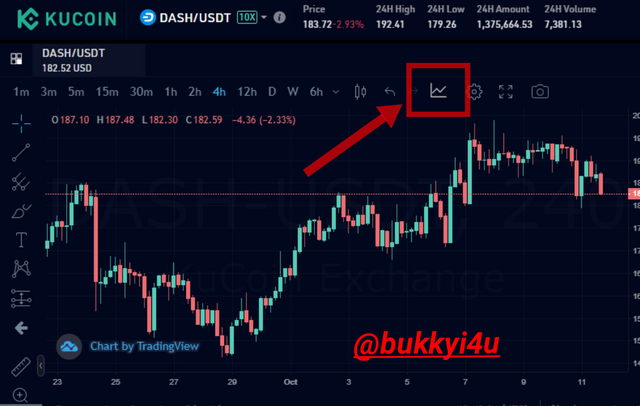
KuCoin
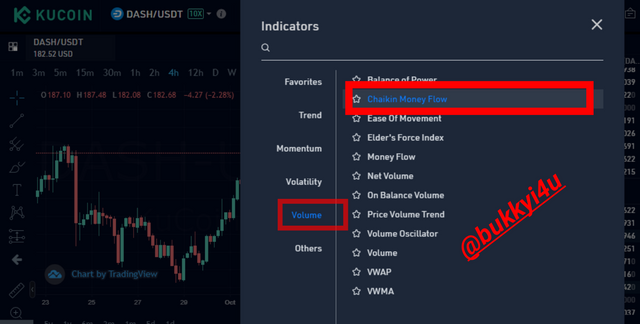
- A new page pops up and I selected Volume as shown to the left and clicked on Chaikin Money Flow as shown to the right
KuCoin
- This automatically adds the indicator to the price chart as shown below
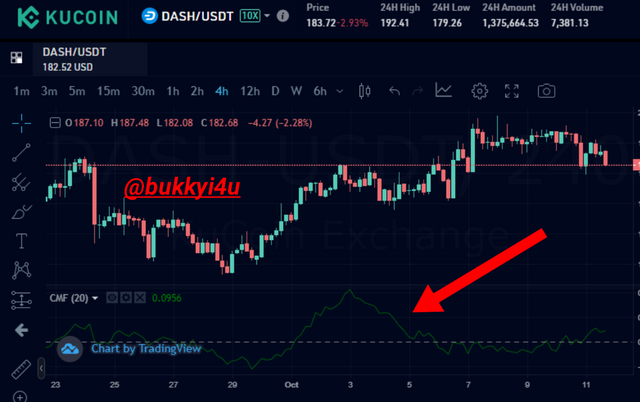
KuCoin
Best Settings For The Indicator
As for the best settings for the indicator we should understand that the 20 periods or 21 periods is more commonly used among traders in calculating the indicator. The originator of the indicator gives the 21-period as it's default setting.
On a longer term, some other traders can use the 50-period with the indicator to identify zones of accumulation or distribution. Generally, you should note that:-
- When the settings of the indicator is increased to 30 or above, fewer but more quality signals would be obtained
- With a setting that is below 20 periods the indicator becomes over-sensitive thereby including more market noise. Consequently, whenever lower settings are to be used with the indicator, a lot of caution should be applied in trading with it as more false signals could be obtained.
Configuring the indicator can be done from the settings tab as shown below:
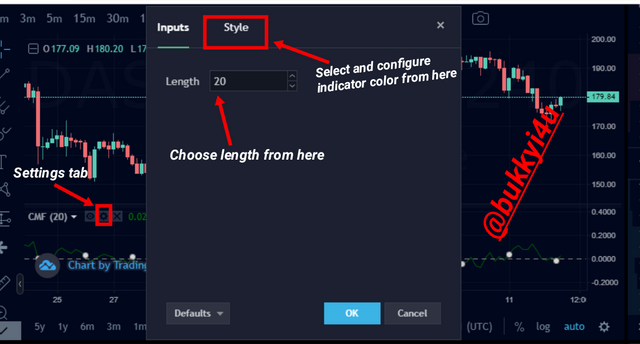
KuCoin
So, you should choose a suitable setting for the indicator based on the style you adopt while trading cryptocurrencies. What is very important is that you back test the indicator with the different period settings in order to understand what works best under the timeframe you conduct your trading activities.
3. What is the indicator’s role in confirming the direction of trend and determining entry and exit points (buy/sell)؟(screenshot required)
With the use of this indicator the confirmation of trend direction is usually based on market pressure that could either be coming from the buyers or the sellers. Trading along with the trend is the most profitable and sure way to engage the market and trading against the trend could be a very dangerous venture. The use of the CMF indicator to identify the ongoing trend would be helpful in giving a trader the much-needed confidence of a trend that is likely to continue in its identified direction.
The values of the indicator are usually denoted on intervals of + 0.5 to - 0.5. It is very rare for the indicator to reach +1 or -1. The buying pressure is assumed to have increased remarkably if the CMF indicator begins to approach +1. The selling pressure is assumed to have increased remarkably if the indicator begins to approach - 1.
Confirming Bullish Trend With CMF
In a bullish trend it is expected that the values of the CMF should remain above 0. This is a good indication that the price of the asset is likely to continue rising. This would be as a result of increased and continuous buying pressure coming into the up-trending market.
The rising prices would normally indicate that a lot of investors are beginning to acquire or accumulate the asset and in a very aggressive manner. This leads to an increased demand that results in prices getting higher. This becomes a good opportunity to trade the market on the buying side.
Confirming bullish trend with CMF indicator
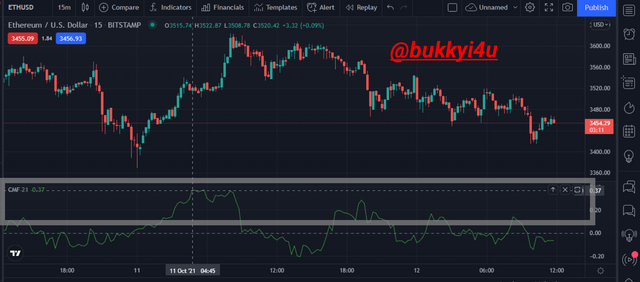
From the ETH/USD price chart above you can notice that in the area indicated by the white box the price goes into a bullish trend and the indicator shows this with its line going above the 0 midline. The stronger the uptrend becomes, the closer the indicator gets to + 1.
From the 10th of October 2021 around 23: 45 UTC the price of the asset picks up and continues higher and this is correlated by the indicator gradually moving above 0 midline. The uptrend continues and the indicator gets as high as 0.37 on the 11th of October 2021 around 04:45 UTC showing a major high point in the uptrend.
Confirming Bearish Trend With CMF
On the other hand, it is expected that in a bearish trend that is marked by continuous and increased selling pressure in the market the values of the CMF should remain below 0. This would be an indication that the price of the asset is likely to continue falling.
The falling prices would normally indicate that a lot of investors are beginning to sell or distribute the asset in a very aggressive manner, especially when the downtrend becomes stronger. This creates an increased supply that makes prices fall lower. It becomes a very good opportunity to trade the market on the selling side.
Confirming bearish trend with CMF
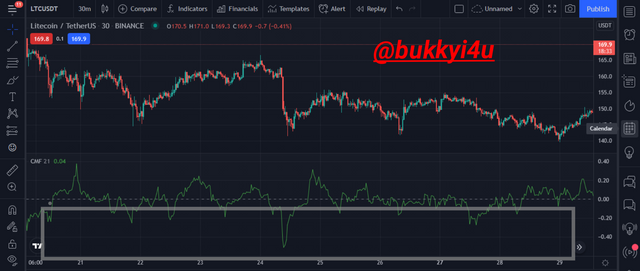
Under the area indicated by the white box the LTC/USDT crypto pair goes into downtrends and the indicator shows these by moving below the 0 midline. Even during uptrends, intermittent downward corrective moves are marked by the indicator still moving below the 0 midline. Sometimes, going just as low as - 0.04 before continuing in the uptrend.
When a downtrend becomes strongest around 24th September 2021 09:00 UTC the indicator goes as low as -0.05.
Determining Entry And Exit Points
In determining when to either make a buy or sell entry and when to also exit while solely using the CMF indicator, we would rely on the concept of the principle behind the indicator itself and that of CMF crossovers.
As I have stated earlier we should understand that when the closing prices are closer to the highs, then more accumulation activities have been taking place in the market. This indicates a more buying pressure within an uptrend and would be marked with positive CMF values.
Conversely, we should also understand that when the closing prices are closer to the lows, then more distribution activities have been taking place in the market. This indicates a stronger selling pressure within a downtrend and would be marked by negative CMF values.
We should be using this principle with the price crossovers to determine entries.
In using price crossovers we can make use of the +/- 0.1, +/- 0.15 or even +/- 0.2. The strategy is to only enter a buy trade when the price of an asset crosses above the + 0.1 line from below the -0.1.
You can also make use of any of the other aforementioned points - that is, +/-0.15 or +/-0.2. However, you should take into consideration the volatility in the market as the crossover will depend on it. Again, you should consider that using a wider range like +/-0.2 would also depend on your trading strategy.
If you are trading on the longer-term, then +/-0.2 may not be a bad idea; but in a shorter term, +/- 0.1 or +/- 0.15 should serve. However, a wider range would come with less frequent crossovers that may be more reliable and stronger, anyway.
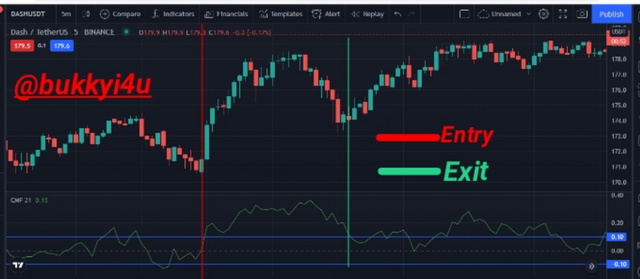
Let me simulate buy and sell entries and exits with the +/- 0.1 mark price crossovers.
Buy Entry Criteria:-
- Ensure that the closing prices are closer to the highs. This should give a positive CMF reading.
- Ensure that the CMF line has moved above the + 0.1 line from below the -0.1 line
- Enter a buy trade as the price crosses above the +0.1 line.
Buy Exit Criteria:-
- You should close the trade at a point where the price goes below the -0.1 line from above the +0.1 line at a later time
- You can place your stop loss one block away from the preceding low point
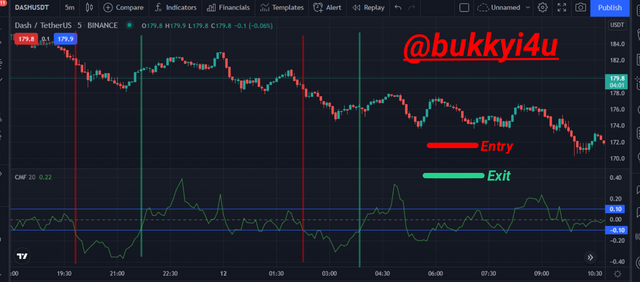
Sell Entry Criteria:-
- Ensure that the closing prices are getting closer to the lows. This should give a negative CMF reading.
- Ensure that the CMF line has moved below the -0.1 line from above the +0.1 line
- Enter a sell trade as the price crosses below the -0.1 line
Sell Exit Criteria:-
- You should close the trade at a point where the price goes above the + 0.1 line from below the -0.1 line at a later time
- Your stop loss should be placed a block away from the preceding high point
4. Trade with a crossover signal between the CMF and wider lines such as +/- 0.1 or +/- 0.15 or it can also be +/- 0.2, identify the most important signals that can be extracted using several examples. (screenshot required)
Trading With CMF Crossover
I will produce clear charts from tradingview and enter positions with my Binance account.
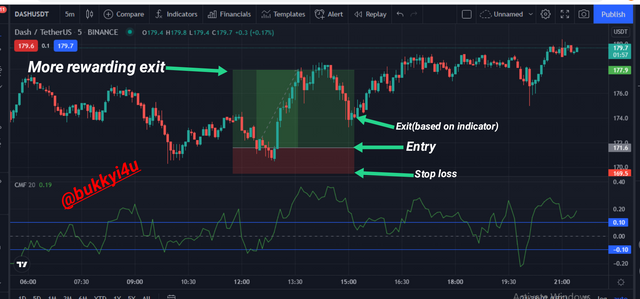
My buy entry
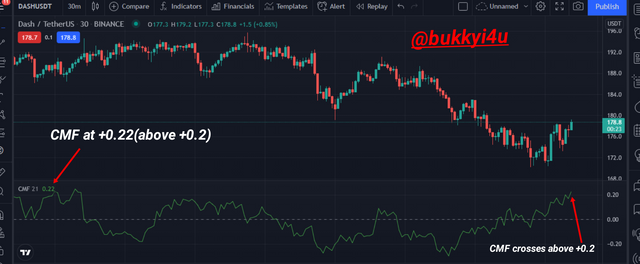
To trade with the CMF crossover strategy on the DASH/USDT crypto pair above, I:
- Ensured that the closing prices of the asset were closer to the highs and this was buttressed by CMF values that had entered the positive region indicating more buying pressure
- Ensured that the CMF line had moved above the +0.2 line from below the -0.2 line
- As the price crossed above the +0.2 line, I entered a buy trade at exactly $178.8
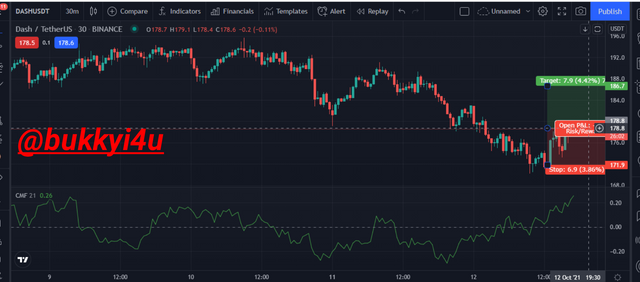
My Exit Strategy:-
My exit strategy
- I set my stop loss below the previous low block at a 3.86% risk
- I set my take profit with a previous resistance level in view at a 4.42% reward
- The trade offered more reward than risk. So, it was worthwhile.
- After some hours I had to close the trade at $180 with a little gain of $0.0265 (This is shown below)
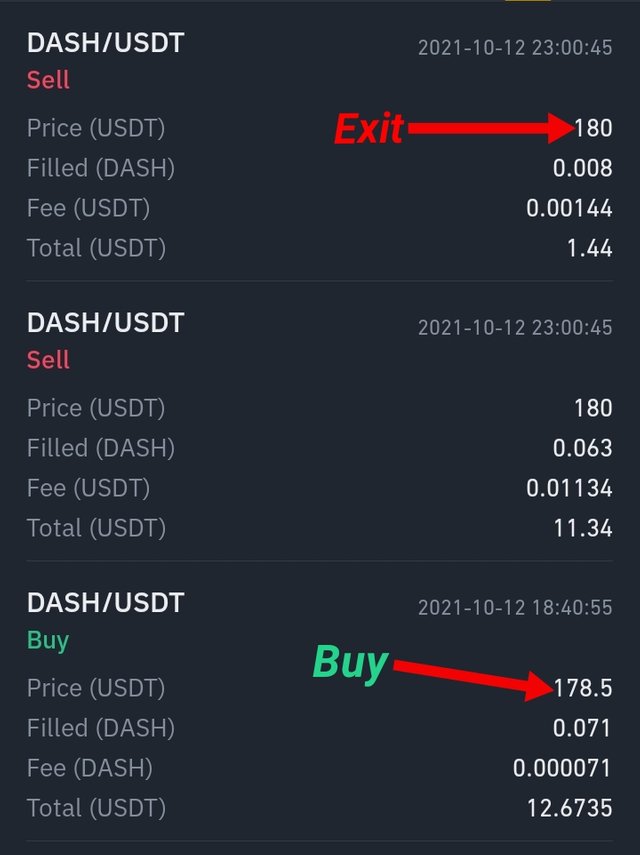
Binance
Buy Signal
CMF buy signal
From the DASH/USDT chart above, a buy signal of the CMF indicator can be clearly seen. As you can see, the indicator has moved from the negative region which would represent a bearish trend and crossed the zero midline way up to the +0.1 mark. The indicator crosses the + 0.1 mark and this is correlated with a price move that breaks to the upside.
This gives a buy signal. This is due to the fact that the indicator moving up to the positive region even way above + 0.1 shows that a lot of buying pressure has come into the market and the market has assumed a bullish sentiment. Traders can open buy positions as the indicator moves from the negative region way up to that positive region and crosses the + 0.1 mark being used in this case.
CMF buy exit signal
A very important factor to consider when planning on how to exit a buy position with the CMF indicator is the risk reward ratio. First, you should never enter a trade which comes with more risk than it offers rewards. From the price chart above you can see how I designated the stop-loss order together with the exit in profit.
The stop loss order is just below a previous low block as shown. Most traders decide not to risk more than 2% of their assets on any particular trade. By the standards of the indicator our exit or take profit should be at the point where I marked exit (based on indicator) due to the fact that this point coincides with the place where the price chart prints a mark which goes below the + 0.1 line.
We had entered the position with the CMF going above the + 0.1. We would exist when the CMF goes below the same +0.1. This ensures that we only exist when the uptrend has been confirmed to be over by the indicator since the CMF is now tending towards the negative side.
However, the disadvantage with this is that we would never get to sell at the top! The point where I marked more rewarding exit is the top that could have offered more profit.
Sell Signal
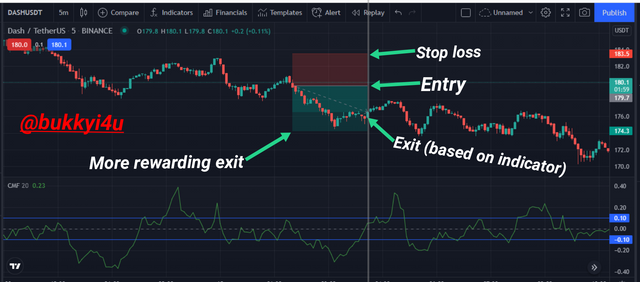
CMF Sell signal
From the DASH/USDT chart above, a sell signal can be clearly seen. The indicator has moved from the positive region which would represent a bullish trend and crossed the zero midline way down to the -0.1 mark. The indicator crosses below the -0.1 mark and this is correlated with a price move that continues to the downside.
This gives a sell signal. This is due to the fact that the indicator moving down to the negative region even way below - 0.1 shows that a lot of selling pressure has come into the market and the market has assumed a bearish sentiment. Traders can open sell positions as indicator moves below -0.1 mark being used in this case.
CMF sell exit signal
The stop loss order is just above a previous high block. Most traders are not willing to lose more than they stand to gain from a trade. The point indicated marked exit (based on indicator) should be our take profit by the standards of the CMF indicator.
We had entered the position with the CMF going below the -0.1. We would exist when the CMF goes above the same -0.1. This ensures that we exit only when the trend is confirmed to be over by the indicator which is now moving towards the positive side.
Unfortunately, we may never have to sell at the top because of this. The point where I marked more rewarding exit is the top that could have offered more profit.
5. How to trade with divergence between the CMF and the price line? Does this trading strategy produce false signals?(screenshot required)
Most times traders are on the lookout to ensure that they are riding in the trend or going along the same direction with the trend. Looking out to trade reversals is a riskier venture. The CMF is one of the indicators that can be used to confirm the current trend and also determine the strength of it to inform trading decisions. Nevertheless, it can also be useful in informing trading decisions based on potential reversals of price action. Using the CMF to trade reversals can be possible when divergences are taken into consideration.
Divergence refers to a situation whereby the price of an asset in the chart disagrees with the indication given by the CMF volume indicator. These situations are quite rare but can be effective in predicting reversals when they occur. The general message of divergences is that the pressure behind the current trend is fading. Divergences can either be bearish or bullish and traders would wait for the reversals to complete before making use of them.
Bearish CMF Divergence
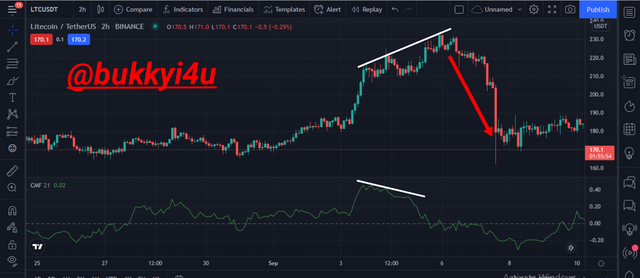
In this type of divergence, the price chart usually indicates a price trend which moves from a high to a higher high while the indicator moves from a high to a lower high at the same time. Usually, it shows that the momentum or pressure behind the current bullish trend is losing its strength. Consequently, price is expected to turn in the opposite bearish direction.
Once a bearish divergence has been created between the indicator and the price chart, a trader should wait for the reversal to actually come into place before placing sell orders. Proper risk management is also advised as this may not always be very accurate.
Bearish divergence with CMF
From the LTC/USDT chart above, the price makes a lower high at around $213.4 and continues higher up to around $231.5. The indicator fails to follow through with a corresponding confirmation of the uptrend. At the point where the price makes the lower high, the indicator records a high value of 0.44. Unfortunately, when the price moves higher up the indicator comes lower down up to around 0.04.
This indicated a very strong negative or bearish divergence and a severe correction of the uptrend follows immediately.
Bullish CMF Divergence
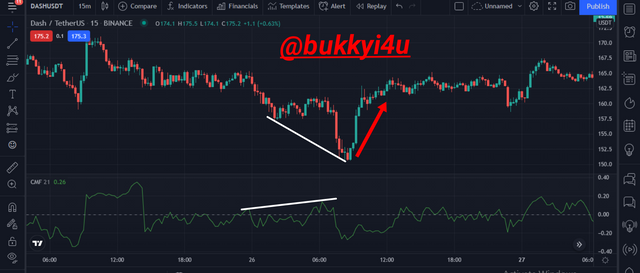
Actually, this type of divergence happens in a bearish trend; it is only called a bullish divergence because it is expected that the price would turn in a bullish direction when it occurs. In this scenario the price chart creates a high and then a lower high but the indicator moves from a low to a higher point.
This would signify that the selling pressure and momentum in the current downtrend is gradually losing its strength. This would often see buyers coming in to support the prices which then move upwards marking an end to the bearish trend.
Usually, traders are advised to wait for the bullish trend to actually come into place before taking on buy positions. Equally, proper risk management in the form of stop-loss orders are advised as trading reversals is generally a risky idea.
Bullish CMF divergence
In the DASH/USDT chart above, the price makes a high point around $158 and continues lower till around $150.8. At the same time the indicator shows a reading around - 0.01 and moves higher with a reading up to around 0.14.
This created a bullish divergence in the downtrend marking a failing pressure of the sellers. As expected a bullish trend occurs just after this divergence was created.
CMF False Divergence Signals
Actually, false signals can be produced with the CMF divergence. This would result in a situation whereby the break-out which occurs in the opposite direction is unconfirmed. A divergence could be created in the indicator and price but the price fails to make the anticipated turn in the opposite direction. Again, divergence could be created which results in breakouts that fail to follow through in the anticipated direction.
If a divergence occurs between price and the CMF indicator, then we can use a suitable EMA to confirm a breakout when it occurs in the expected opposite direction. The failure of price to either break below or above the EMA should confirm a false breakout signal with divergence.
CMF false divergence
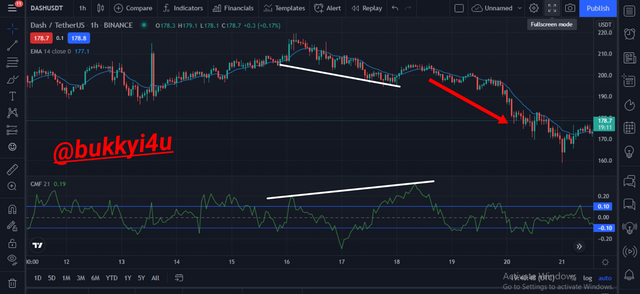
In the DASH/USDT price chart above the price prints a high around $207.1 and cons lower up to around $195.9. The indicator does not move in the same direction but rather prints a high around 0.20 and continues even higher up to around 0.32. This created a bullish divergence that seemed to suggest that buyers were coming in to support the market.
Unfortunately, the EMA only shows that the price moved up above it momentarily with weak bullish candles and goes back down below it immediately and continues in a bearish trend which is equally accentuated by the indicator falling even far below up to - 0.12.
In the case of breakouts, the strength of such a breakout should come into play. Using the CMF volume reading is our only chance in determining what would become a successful breakout with the CMF indicator. How, then, do we confirm the strength of such a breakout with the CMF volume reading?
In determining the strength of a breakout with CMF, we should rely on the volume readings. Consider a situation whereby price breaks above a resistance level but the readings of the CMF indicator remain negative. Chances are that this is a false breakout of the resistance.
However, if the reading of the CMF volume indicator is above the zero midline as resistance is broken, it is assumed that a lot of buying pressure has stepped in. Consequently, there are higher chances of obtaining a winning trade with this particular breakout should we decide to trade in the same direction.
Furthermore, if a breakout of the support line occurs with CMF volume readings going below zero, it would be assumed that a lot of selling pressure has entered the market. This gives the breakout higher chances of meeting success.
However, if the support line is broken but the readings of the CMF indicator remain positive chances are that this is a false signal. This would invalidate any divergence that may have even been created between price and indicator prior to the breakout.
CMF false signal
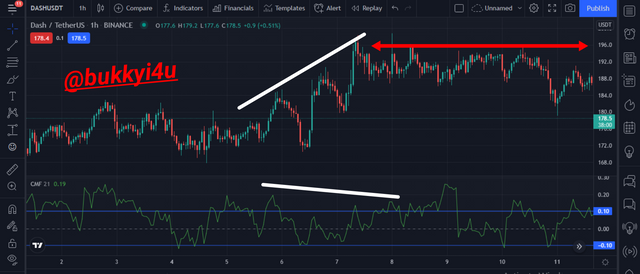
In the DASH/USDT chart above, the price had made a high and moved higher with a new maximum. Unfortunately, the indicator makes a high and rather goes lower with a new minimum. This bearish divergence seemed to suggest an impending downtrend which should have been followed by the indicator moving to the negative region below the 0 mark.
Unfortunately, the indicator only moves closer to the 0 mark and retracts away from it upwards again and simply goes into a range and not the anticipated downtrend.
CONCLUSION
The Chaikin Money Flow Volume indicator can be helpful in not just identifying upward and downward price movements but in telling when accumulation or distribution is actually taking place over a specified period of time. The values it indicates fall between +1 and -1. Equally, there is a zero(0) mark which when crossed can indicate changing momentum and pressure in the market.
Positive values above the zero mark and negative values below the zero mark indicate buying and selling pressures respectively. The indicator is readily available on trading platforms and other market softwares. Its settings can be changed to suit one's trading strategy.
In a bullish trend it is expected that the prices should remain above the 0 midline with positive values. In a bearish trend it is expected that the price should remain below the zero midline with negative values. You can make use of the principle behind the indicator itself together with price crossovers to determine your entry and exit strategies.
(Unless otherwise indicated, all screenshots are taken from TradingView)


Congratulations! Your post has been selected as a daily Steemit truffle! It is listed on rank 19 of all contributions awarded today. You can find the TOP DAILY TRUFFLE PICKS HERE.
I upvoted your contribution because to my mind your post is at least 12 SBD worth and should receive 43 votes. It's now up to the lovely Steemit community to make this come true.
I am
TrufflePig, an Artificial Intelligence Bot that helps minnows and content curators using Machine Learning. If you are curious how I select content, you can find an explanation here!Have a nice day and sincerely yours,

TrufflePigHi @bukkyi4u
Thanks for participating in the Steemit Crypto Academy
Feedback
Total| 10/10
This is excellent work. Thanks for demonstrating such a clear and well-detailed understanding of Trading with the Chaikin Money Flow Indicator.
Hello,
I have some confusion about calculation
Is it for 1 period or for 20 periods? as in the formula it requires the sum of 20 periods.
Please clarify it. Thanks!
@bukkyi4u @kouba01
The MFV uses the volume for the current period while the 21-day average volume is actually a weighted mean of the volumes in the entire period.