Steemit Cryptoacademy Week 16 Homework Task Submitted To Professor @kouba01|Cryptocurrency Trading With Bollinger Bands| By @bukkyi4u
Define the Bollinger Bands indicator by explaining its calculation method, how does it work? and what is the best Bollinger Band setup?
WHAT ARE BOLLINGER BANDS INDICATORS AND HOW DO THEY WORK?
Bollinger bands indicators refer to a sort of tools for technical analysis which were developed in the 1980s by a man called John Bollinger. These tools are good for the trading of cryptocurrencies. The bands are made up of a volatility indicator which can work by measuring the relative lows and highs in the prices of a cryptocurrency when considered in relation to trades that had occurred earlier. In measuring volatility the standard deviation is used. This standard deviation experiences changes due to volatility increases or decreases. When there is an increase in price the bands would widen. When there is decrease in price the bands narrow down. This dynamic nature of the Bollinger bands makes it a very good tool for the trading of various cryptocurrencies.
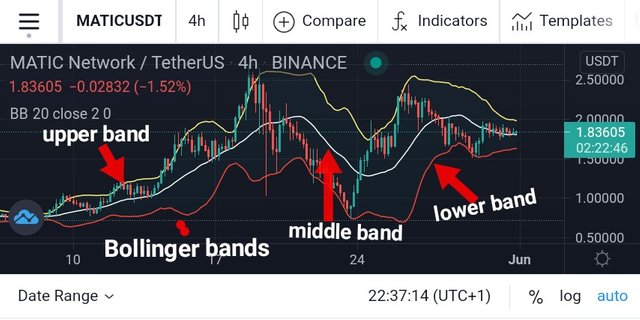
Actually, Bollinger Bands are made up of three lines. These lines include the lower band, the middle band and the upper band. Usually, the middle band is indicated as a moving average. The parameters of the moving average would be chosen by the trader to suit his trading decisions. The lower and upper bands are located to the both sides of the moving average band. The standard deviation which the volatility indicator would be set at would usually be determined or chosen by the trader. In turn, the standard deviation will determine the distance that will exist between the lower, the middle and the upper band lines. Interestingly, the position of the bands actually indicates how strong and provides information on the strength of the current trend. Furthermore, it gives information on the high or low price levels that may be expected in the current trend in the near future.

HOW TO CALCULATE BOLLINGER BANDS
The knowledge of some important formulas are necessary in the calculation of Bollinger Bands. They include:
- Calculation of the 20 period simple moving average
- Calculation of the standard deviation
- Determining the upper and lower bands from the calculated standard deviation
Formula For Bollinger Bands
In calculating standard deviation you have to first figure out the x Bar. This is the typical approach in maths solutions. In this calculation, the x Bar actually refers to the Simple Moving Average (SMA). So, this formula technically calculates the SMA.
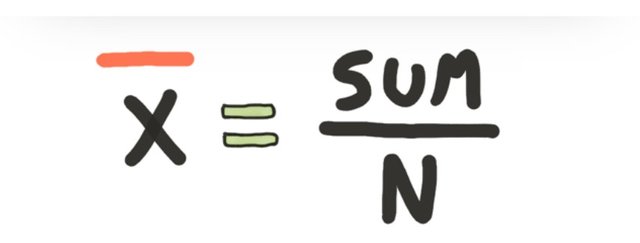
In the above formula:
- X Bar is the SMA value
- Sum refers to the values of the entire period we are using.
Usually, the 20 period is used. In that case the values of the entire 20 periods would be added together.
- N refers to the number of periods to be used (which is 20 in this case)
Therefore, from the formula above the total values of the period under review should be added and then divided by the amount of periods.
Step 02:
We calculate the standard deviation from the formula below:
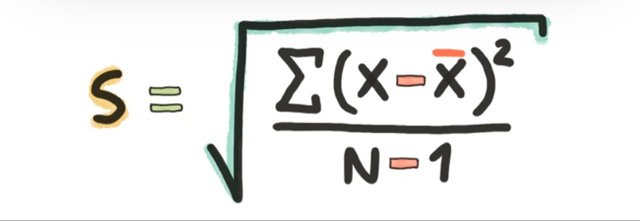
From the formula above:
- S represents standard deviation
- The first Greek symbol inside the bracket means summation and is known as the Sigma sign. This tells us that while making any calculations here we need to individually insert all the figures that were added up to get the SUM. This means we should take a value from all the values that were added to get the SUM, subtract X Bar from it and square the answer you get. Do this for all the other values and add up all the squares.
- X refers to each of the numbers that we used in calculating our SUM individually represented.
- X Bar is the standard value SMA
- N represents the number of periods which is usually 20 in standard configuration
Step 03:
We use the value of our standard deviation to calculate the values of the upper and lower bands.
To calculate for the upper band:
SMA + ( SD X 2)
To calculate for the lower band:
SMA - ( SD X 2)
This is a simple working methodology that has been developed for the calculation of Bollinger bands.
THE BEST BOLLINGER BANDS SET-UP
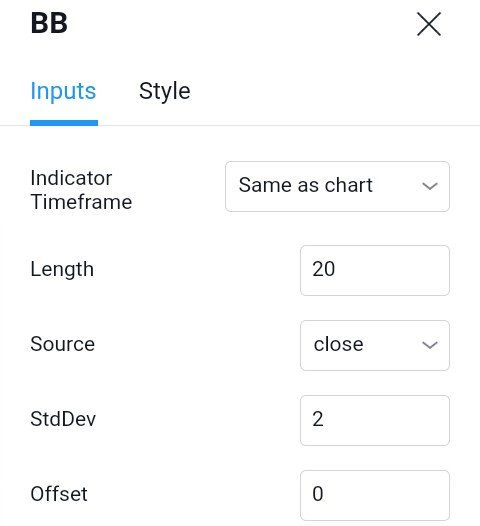
Really, the best Bollinger Bands settings and setup is still the default setting. Actually, there may not be any need to waste your time on something else. This default Bollinger Bands setting comes with a middle band which represents a 20-day moving average. However this would be for a trader who wishes to hold positions for more than 20 days. For an intraday trader you can set it to 20 minutes. Again, for a long-term trader you can still set it to 20 weeks. It all depends on your trading strategy.
In placing the upper or lower bands it should be understood that even before John Bollinger, technical analysts had come up with a sort of strategy in calculating price volatility and envelopes (low or high points) that could be placed to the sides of price movements. A few experiments that had earlier created envelopes as points of high and low of price movements included:
- Keltner moving average experiment
- The Donchian Channels 4 week experiment
- The 21 period moving average Bomar Bands which were developed by Marc Chaikin and Bob Brogan
- The Jim Yates overbought and oversold strategies
John Bollinger actually built more by borrowing from the works of Brogan and Chaikin with BOMAR Bands. Also, the Jim Yates strategies were quite instrumental. He developed the strategy by:
- Using volatility to determine the location of the bands
- Using 2 standard deviations both above and below the price movements
So, the best settings of the Bollinger Bands as propounded by its initiator uses two standard deviations to predict the potential odds in future prices of a particular price movement. However, the price volatility would first be calculated as a moving average based on your chosen period of time and then two bands will be placed to 2 standard deviations. Interestingly, 88 to 89% of price movements were discovered to be usually confined to 2 standard deviations.
What is a breakout and how do you determine it? (Screenshot required)
Price breakout in cryptocurrency simply refers to a price movement that goes above or below defined resistance or support levels or areas in a cryptocurrency price chart. Depending on the pattern of the price action the breakout can occur on a diagonal or horizontal plane.
One other interesting way the Bollinger Bands work is that it indicates M-patterns and W-patterns which can be used to determine breakouts. These patterns are a sort of market trend patterns with W-bottoms and M-tops that were identified by Arthur Merrill in his work which identified 16 patterns with respective W-patterns and M-patterns.
With the use of Bollinger bands W-bottoms can be identified with a W-pattern representation. Usually, This happens when the price makes a first low and a second low which is lower than the first but remains above the lower band. This occurs when a low forms below or close to the lower band as a reaction low. From there the price then pulls back towards the middle band or even above it. At that point the price makes a new low which must be above the middle band. The price then moves lower from there towards the lower band. From there it moves up higher towards the middle band. If it goes higher than the previous pullback, then a possible new high price is created. More so, this makes the W-bottom as shown below:
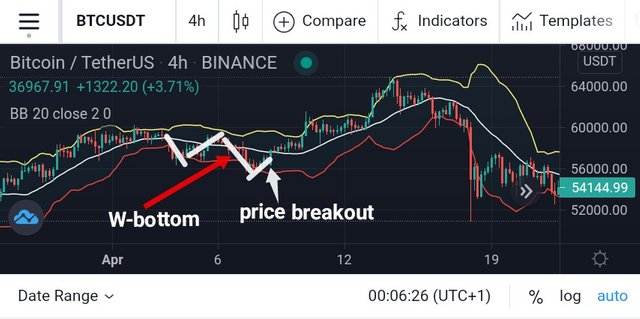
This point where the second pullback makes a high price that is higher than the first high price made by the first pullback represents the point of price breakout.
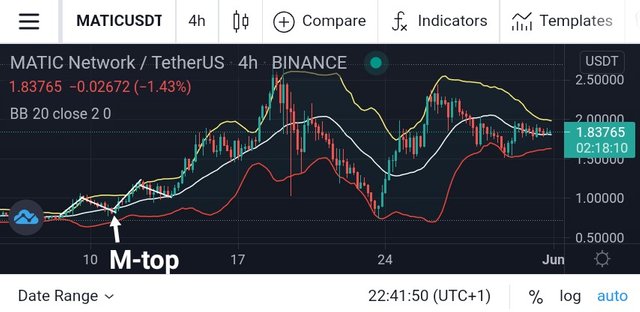
Furthermore, John Bollinger identified M-tops with the use of M-patterns in Bollinger Bands. Usually, when the M-top is fully represented it actually occurs as a double-top in the price chart. The M-top is normally created whenever there is a price reaction which moves close to or above the upper band. From there the price then moves close to or below the middle band and then journeys up to form a new high price which must be below the upper band. The price then moves down from there and moves lower than the previously-formed pullback. This creates the M-top as indicated below:
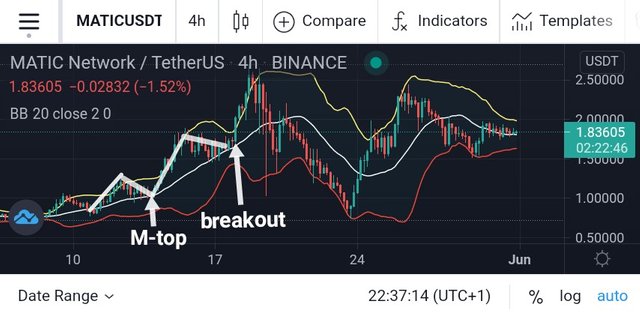
The point where the second pullback creates a low that is lower than the low price of the first pullback represents the point of price breakout level.
How to use Bollinger bands with a trending market? (screenshot required)
Bollinger Bands can be used to determine or understand the ongoing trend in a cryptocurrency market. This is quite important as traders would normally hope to engage in trading activities in an active and strong uptrend. Again, traders would normally want to avoid trading when the market is in an unprofitable and monotonous downtrend with a very low volatility. Interestingly, the Bollinger bands have their ways of indicating uptrends and downtrends.
HOW TO USE BOLLINGER BANDS IN UPTRENDS
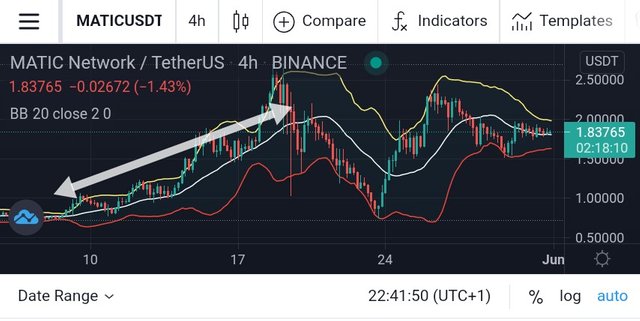
Bollinger bands can be used when trying to understand how strongly a crypto may be rising. Again, it can be used to determine when the crypto is losing strength. Usually, a strong uptrend reaches the upper band quite regularly. When an uptrend reaches the upper band it indicates that the crypto is gaining more strength and pushing up even higher. This would be a good time for buyers to come in. When prices pull down from the upper band, come down to the middle band and go up again to the upper band, it indicates a market with a strong uptrend. A market in the uptrend is not expected to touch the lower band. If this happens then it is a sign that the market is possibly going to reverse. Also, it could mean that the crypto is losing some strength.
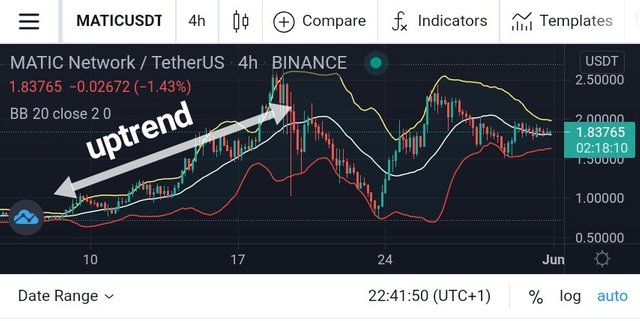
The price chart above indicates a market trend that is trading in the regions of an uptrend. As a technical trader you should hope to benefit from the uptrend before a reversal sets in. If the crypto fails to reach a new peak after sometime this will be a good place to take profit to avoid possible incoming price reversal. Monitoring the strength of the uptrend or the weakness of it is a vital metric for technical traders. So, it is important to monitor and know how strong the uptrend may be in order to be able to decipher when a downward reversal is imminent due to a weakening uptrend.
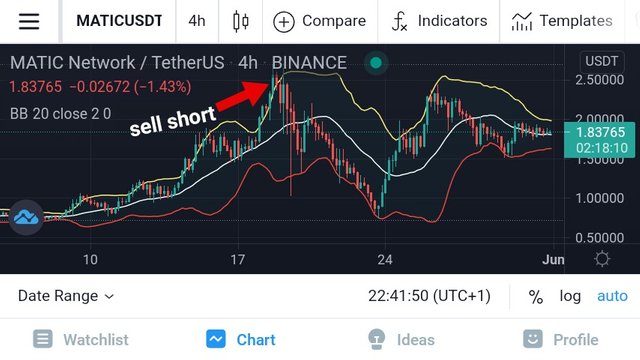
Importantly, traders can sell short whenever the prices of cryptocurrencies pierce and shoot out above the upper band of the Bollinger Bands. Such points of outward price shootouts above the upper band of the Bollinger Bands is as represented below:
HOW TO USE BOLLINGER BANDS IN DOWNTRENDS
Again, Bollinger bands can be used in determining how strongly the price of a cryptocurrency is falling. This would be instrumental in giving information on when it is about to result in an upward reversal. Usually, when the downtrend is strong the price would keep running along the lower band as a way of indicating stronger selling activities. However, if the price is no longer running or fails to touch the lower band then it is a sign that the downtrend in price is losing a lot of momentum. Anytime a pullback (new high) is made and the price does not go above the middle band but falls back to the lower band it is an indication that the downtrend is still strong. It is not expected that the price would go above the middle band. If this happens it is an indication that the downtrend is losing strength or may be about to reverse.
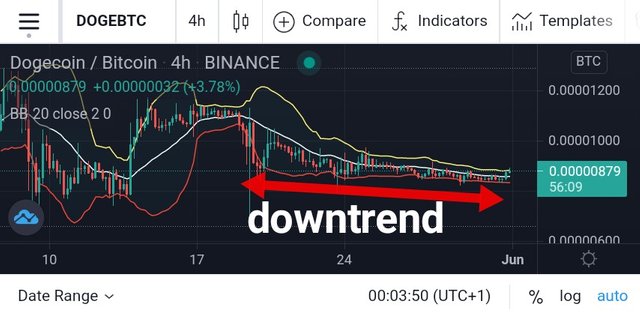
The price chart above shows the market trend that is currently experiencing a downtrend in price action. Normally, traders like avoiding downtrends when it comes to trading. These downtrends could last for a short or even longer period. It could last a few minutes, a few days or even a few months or years. The Bollinger Bands can be quite instrumental in helping traders to identify an impending downtrend early enough. This will be helpful in making them protect their investments as traders are usually mindful and careful to avoid downtrends that may not result in any profitable trade.
What is the best indicator to use with Bollinger Bands to make your trade more meaningful? (Screenshot required)
Actually, I discovered that different people have different ways of combining a lot of different indicators together with the Bollinger Bands. However, I discovered that the most popular and very meaningful choice is the RSI.
Using The RSI Indicator With Bollinger Bands
When combining the RSI with Bollinger bands should set up the Bollinger Bands as has already been described in this article. Then, set up the RSI with 70 and 30 indicating the overbought and oversold regions respectively. After that you change the length of the RSI from 14 to 13. This will be necessary for this particular strategy.
In using the RSI with Bollinger bands, we are going to be using a strategy that is developed and built upon a concept known as mean reversion. But then what is the meaning of mean reversion?
- Mean refers to Average
- Reversion means Returning to
So, mean reversion simply means returning to the average. Therefore,in this trading strategy we are going to carefully wait for prices to stretch out in one direction and enter a trade with the expectation that it will return to the average. So, when price stretches to the outside of the upper band we enter a sell trade expecting that the price would come down. When the price stretches to the outside of the lower band we enter a buy trade with expectation of price going back up.
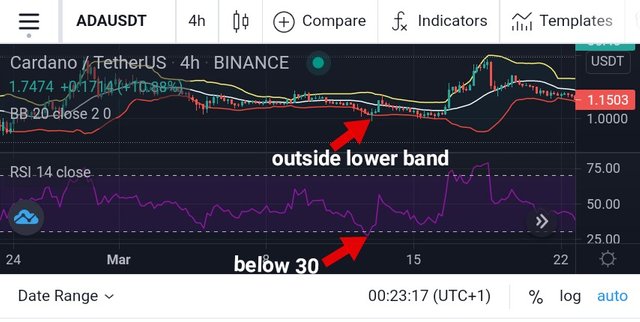
However, this alone is not enough to inform our trade entry decision. So, it is necessary to combine this with the RSI. When prices have moved outside the lower band we will wait for the RSI to move to an extreme level of at least 25. Then, we can enter a buy trade. When prices have moved outside the upper band we will wait for the RSI to hit an extreme value of at least 75 before entering a sell trade. Nevertheless, for a sell trade you have to be sure that sellers are coming in before you enter. This is usually indicated at the point where prices make an attempt of pushing higher eventually a bearish engulfing candle is formed. Then the sell trade can be entered with the stop loss at the previous high earlier formed.
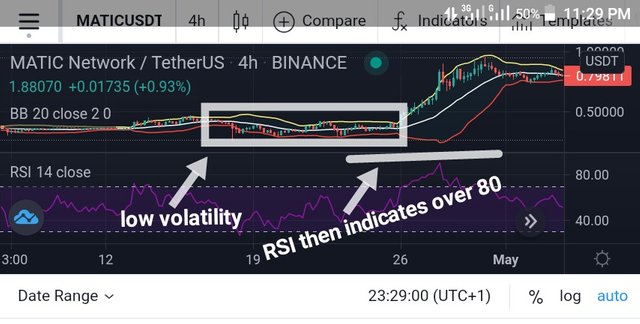
Nonetheless, before using this strategy you must ensure that the market is not experiencing a strong trend whether downward or upward as this can result in RSI hitting 75 or 25 and instead of price reversing, the RSI would then hit values that are higher than 75 or lower than 25. You should wait for the strong trends to end before engaging in this strategy. Strong trends are usually preceded by periods of low volatility in the market. As a strong indicator for a market where a strong trend is imminent you should notice that prices are usually stuck in between close ranges. Also, in such situations the RSI indicates levels that are above 70 or lower than thirty for a long time.
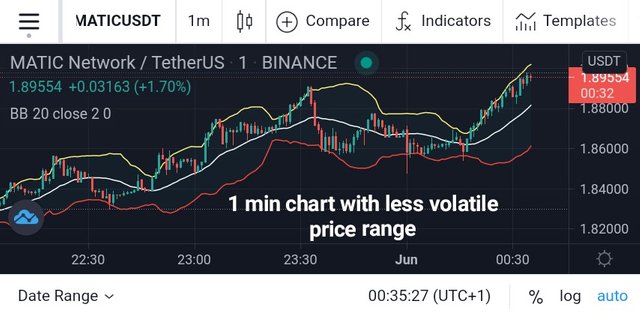
What timeframe does the Bollinger Bands work best on?And why? (Screenshots required)
Actually, from my study of the Bollinger bands I have come to realise that a time frame that uses at least a 20-day period moving average should be more reliable. To start with, since the moving average is calculated as volatility in price movement it has been observed that more or higher volatility in price movements can indicate a clearer trend. This kind of volatility can usually be achieved with an at least 20 day moving average.
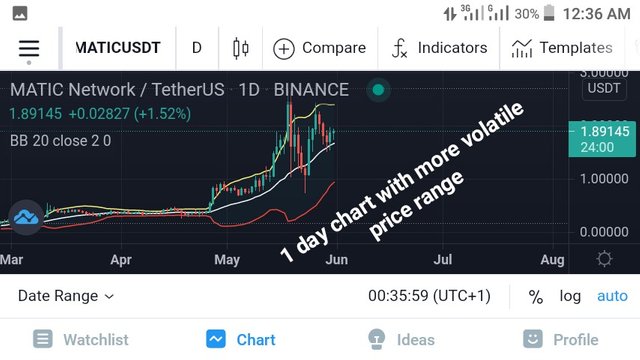
Furthermore, using a standard deviation of a smaller time frame like 10 days which would use 1.5 standard deviation may no longer indicate results as we're accurately based on the findings of John Bollinger, the propounder of this indicator. Based on his findings he discovered that usually 88% to 89% of price movements are located within 2 standard deviations. So, from my observations and experiments as well as calculations, a time frame that uses at least a 20-day period price moving average and 2 standard deviations would work best. This is not to discourage scalpers, though, as others have also received good results with lower time frames..
Review the chart of any pair and present the various signals giving by the indicator Bollinger Bands. (Screenshot required)
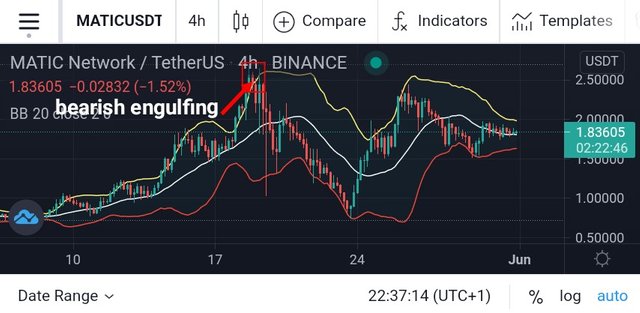
The Matic/TetherUSD chart above presents three important signals of the Bollinger Bands indicators. These signals include:
- Bearish engulfing outside upper band
- M-top
- Uptrend
Bearish engulfing outside upper band
At the point of bearish engulfing the price had journeyed downwards and hit a level outside the upper band. Actually, it is expected that traders would sell short since a downward price reversal is imminent. However, this possible downward reversal must be first confirmed. The confirmation comes with a bearish engulfing candlestick indicated in the screenshot which actually does herald the downtrend.
M-top
The M-top pattern is created in the cryptocurrency pair above. As has already been explained earlier it comes from the price action within the upper band and the middle band. It heralds a price breakout which is actually in place in the screenshot indicated. Trading decision here would be based on whether the breakout forms a bullish or bearish engulfing.
Uptrend
The uptrend has already been explained to represent price action that oscillates between the upper band and the middle band without going to the lower band. It indicates a trending price action in the upward direction. Coincidentally, it occurs in the cryptocurrency pair above. Traders should look to buy when prices come below the upper band and move towards the middle band. They should look to sell short when prices move above the upper band and form bearish engulfing.
CONCLUSION
The use of indicators in the trading of cryptocurrencies is quite a welcome development. The Bollinger bands are important in giving some vital signals that can be useful for making necessary trading decisions. Interestingly, they can be combined with other indicators to present better confirmatory trading guides. These guides will usually occur in places of confluence between the indicators. Such complementary indicators include the RSI.
Thanks to professor @kouba01 for the wonderful lecture on Bollinger bands.
(Unless otherwise indicated, all screenshots are taken from TradingView.com)
Hello @bukkyi4u,
Thank you for participating in the 8th Week Crypto Course in its second season and for your efforts to complete the suggested tasks, you deserve a 10/10 rating, according to the following scale:
My review :
A very good job in which you have dealt with the subject of trading using the Bollinger Bands indicator in all its aspects in a clear manner and with some useful additions such as W-Bottom and M-Top signals. You have explained the M-Top signal very well and concerning W-Bottom I want to add that it is composed of 4 elements:
Thanks again for your effort, and we look forward to reading your next work.
Sincerely,@kouba01
Thank you professor @kouba01 for taking your time to review my work. I earnestly look forward to participating in your next assignment. Meanwhile, thank you for the additional information on W-bottoms.