Steemit Crypto Academy / Season 3 / Week 6 / Advanced Homework Submitted To Professor @cryptokraze : Trading Liquidity Levels The Right Way / By @bukkyi4u
The Week 6 lecture delivered by professor @cryptokraze has given me a very wonderful opportunity to learn more on how to correctly trade the liquidity levels. This is particularly timely as it would help me to guard against any wrong notions I may have encountered before now on the trading of support and resistance levels.
What is your understanding of the Liquidity Level. Give Examples (Clear Charts Needed)
Liquidity levels are places where orders can be easily filled without the price of the underlying asset witnessing any significant change. Actually, this is based on the fact that there are very large order flows in such places. Most times these order flows come from institutional or large traders. Such institutions like big banks and hedge funds contribute huge funds to the trading of the asset in such places thereby making it easy for orders to be filled there.
In most cases the market is likely to reverse at the liquidity levels. This is due to the fact that a large order of stop losses, especially from institutional traders, are always hidden in such levels. Most times these important areas could be visualised as support or resistance areas. Prices would usually make swing highs or swing lows at such places. Also, it could create M-tops or W-bottoms at such levels.
LIQUIDITY LEVELS IN UPTREND
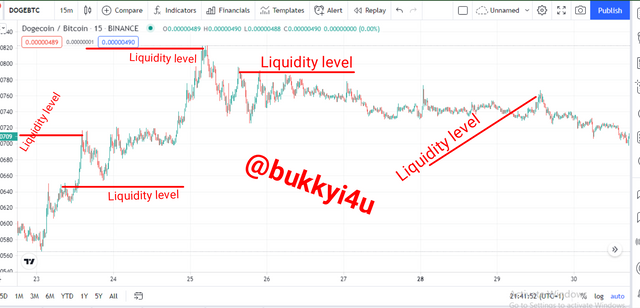
These liquidity levels in uptrends are the places where sellers put their stop-loss orders should in case the market goes against them. Such sellers are usually willing to buy - stop - the market at such places. Usually, they are more expensive or higher than the sell level.
So sellers who had been hoping to take profit at cheaper levels are forced to buy at such more expensive or higher levels when the trade goes against them. Normally, fulfilling their buying stops at such more expensive levels will most likely push prices downwards. Such levels become more significant when they come from institutional traders and could often occur a little above key resistance levels. Also, these are places where buyers may be hoping to take profits.
LIQUIDITY LEVELS IN DOWNTREND
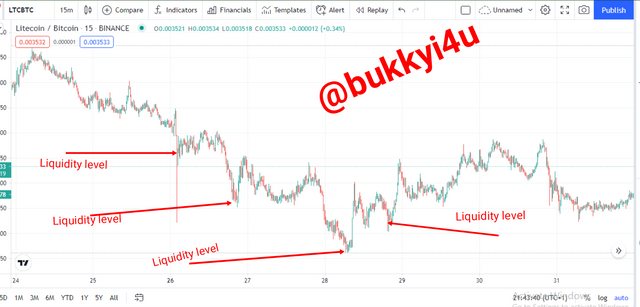
The liquidity levels in downtrend are the places where buyers place their stop loss orders. This means that the buyers identify them as places where they will most likely sell their orders at a cheaper rate if the market should go against them. Fulfilling the sell stop - stop loss - of such open buy orders from large institutional traders like hedge funds would normally work in turning prices upwards from there.
Usually, such places would occur a little below the key support levels. As usual, they become more relevant and powerful when they come from large institutional traders. Again these are places where sellers may be hoping to take profit. As such, large take profit orders are equally set around such levels.

Explain the reasons why traders got trapped in Fakeouts. Provide at least 2 charts showing clear fakeout.
False breakouts or fake outs refer to points in the cryptocurrency trading chart where prices break above the resistance level or below the support level to get to but suddenly reverses from there failing to continue in the envisaged direction of the breakout. Fakeouts in resistance levels occur as a result of excessive supply of the asset at a price which is above the resistance level.
In support levels they would occur as a result of excessive demand where traders are willing to buy the asset at a price lower than the envisaged support level. These excessive supply or demand that are capable of either pushing prices up or down and suddenly reversing it usually come from the large or institutional traders. These fake out prices are usually induced traps used as bait when the institutional traders hope to benefit from the reversal of prices.
FAKEOUTS IN UPTREND
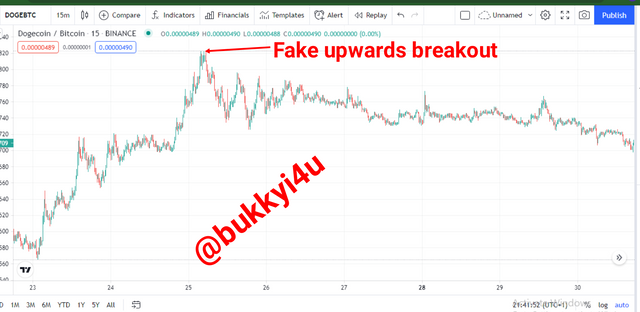
Usually, inexperienced or careless traders get stuck in fake breakouts when they fall into the induced bait of institutional traders and secondly when they fail to do their due diligence by trading unconfirmed breakouts. Fake outs can occur in uptrends when the stop loss orders placed by large institutional sellers above resistance levels rather get filled. These stop losses are like traps set in such places.
They get filled only for prices to reverse downwards in the desired direction of the large institutional trader who actually hopes to benefit from a sell trade. A support and resistance levels trader who only waits for a breakout of the resistance level without waiting for proper confirmation would be deceived to buy at this resistance that has been broken to create a new support level. Since he only has the idea of buy at support and sell at resistance he enters a buy trade in this new fake support level (breakout of former resistance).
Later in this article I will show the confirmation this retail trader should have waited for.
FAKEOUTS IN DOWNTREND
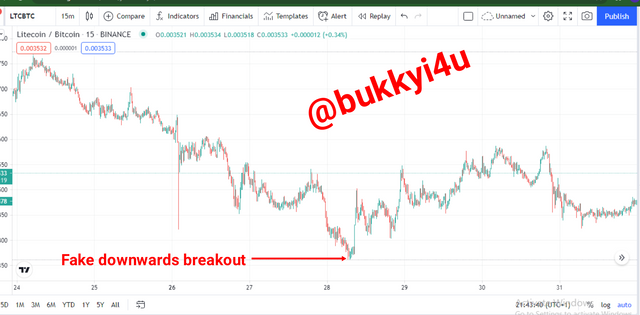
In a downtrending market, inexperienced or careless traders could fall for the trap of fake breakouts induced by large institutional traders. These large institutional traders, who actually have the intention of trading an uptrend, enter a trade in the desired upwards direction and hide a stop loss below the support level. In the case that their stop loss order gets filled, it would seem to have pushed prices lower than the support level which already exists.
The support and resistance level trader who believes in selling at resistance shorts the market at this supposed new resistance (downwards breakout of former support). Unfortunately for the retail trader, the price reverses in the desired direction of the institutional trader. This is due to the fact that the retail traders failed to wait for a confirmation before shorting the market.
How you can trade the Liquidity Levels the right way? Write the trade criteria for Liquidity Levels Trading (Clear Charts Needed)
Different traders seem to have come up with different strategies on how to trade the liquidity levels. However, for the sake of this study I am going to be looking at the two possibilities of trading the liquidity level with the Break Retest Break(BRB) strategy in the case of a continuation. Again, I will point out how to trade the liquidity level with the Market Structure Break(MSB) in the case of a reversal.
In trading the liquidity levels in the right way for a market in continuation the trader should wait for a retest of the support or resistance level that has just been broken out. After this broken out level has been tested, the trader should then wait for the price to continue in the original direction of the breakout and eventually break above or below the initial swing high or swing low that had been created by the first breakout. For this particular BRB strategy I will give clear charts for both buy and sell setups in the last section of this write-up.
In trading the liquidity level with the MSB strategy you should wait for a market that has been trending upwards and creating higher highs to suddenly create a lower high. Then you should draw a neckline and then wait for a clear downward break of this neckline before making an entry. If the market is trending downwards by creating lower lows you should wait for the market to create a higher low. Then you draw a neckline of the price action at that point and wait for a clear upwards break of this neckline before making an entry.
TRADING LIQUIDITY LEVELS IN UPTREND
In trading the liquidity level the right way at the resistance level of an uptrend, I am going to be exploring the possibility of the MSB strategy in the case of a reversed upward trend. However, I will also give a clear chart of how to trade in the scenario of a continuation of an uptrend with the confirmatory BRB strategy in the last section of this study.
In trading the liquidity level at market resistance the correct way you should follow the criteria below:
- First, you should check properly to ensure that the market is in a bullish trend and is making successive higher highs
- Then you should ensure that a lower high is created after price has made a breakout with a higher swing high (which is likely the induced trap of the institutional trader)
- Once this lower high is created you should draw a neckline of the price action at that point
- A downward break out of such neckline defines your sell entry point
- You should set an order to take profit in the desired downward direction.
- Also, you should set a stop loss order above the lower high to exit if the market structure is invalidated and goes against you
TRADING LIQUIDITY LEVELS IN DOWNTREND
In trading the liquidity level at the support level of a downtrend, I am going to be exploring the case of an MSB strategy for reversal. Nevertheless, I will also give a clear chart of how to trade this level with the BRB strategy in the last section of this study.
In trading the liquidity levels at market support the right way you should follow the criteria below:
- First, you should check to ensure that the market is currently in a bearish trend and is making successive lower lows
- Then, you should look to ensure that a higher low is created after price has made a breakout with a lower swing low (which is likely the buy induced trap of the institutional trader)
- The moment this higher low is observed you should draw a neckline of the price action at that point
- An upward break of this neckline defines your point of buy entry
- Then you should start an order to take profit in your desired upward direction
- Also, you should set a risk management stop loss order below the higher low to exit in case the market structure is invalidated and goes against you
Draw Liquidity levels trade setups on 4 Crypto Assets (Clear Charts Needed)
In drawing the trade setups for both buy and sell trades at liquidity levels I would give clear charts for both MSB strategy to trade reversals and BRB strategy to trade market continuity.
LIQUIDITY LEVELS TRADE SETUP IN UPTREND
Liquidity levels can occur at the resistance zones for an up-trending market. In such a situation you can use BRB or MSB to confirm continuity and reversals respectively.
Setup In Upward Continuation
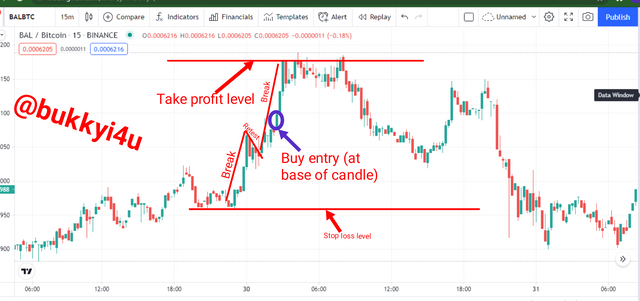
The BAL/BTC 15 minutes chart above shows the correct BRB setup to trade the liquidity level at resistance level in a continuation. It shows the higher high created by the break pattern. Then, it shows the retest move as well as the final break of the initial higher high. Also, it shows the buy entry point together with the potential take profit and stop loss order.
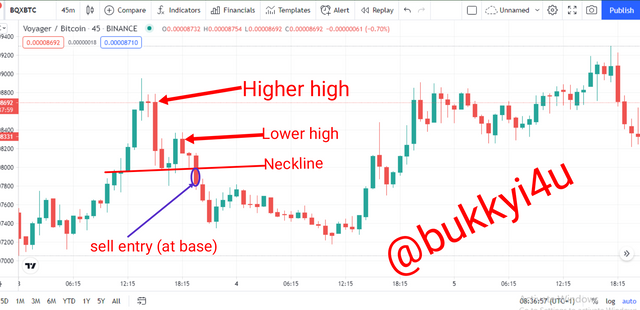
Setup In Reversal Of Uptrend
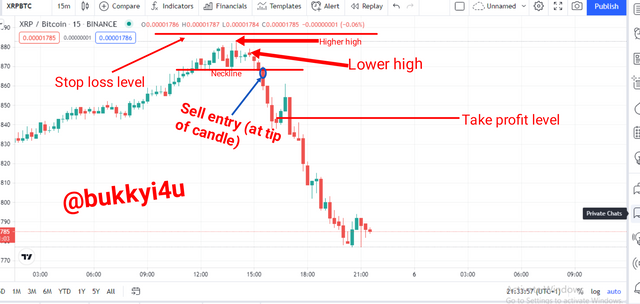
The XRP/BTC 15 minute price chart above shows the MSB set up to rightly trade the liquidity level at the reversal of an uptrend. It indicates the higher highs and the lower high. Also, it shows the neckline of price action as well as the sell entry point. Equally, it indicates the areas of take profit and stop-loss orders.
LIQUIDITY LEVELS TRADE SETUP IN DOWNTREND
Liquidity levels can occur at support zones for a downtrending market. In such a situation you can use BRB or MSB strategies to trade market continuation or reversals respectively.
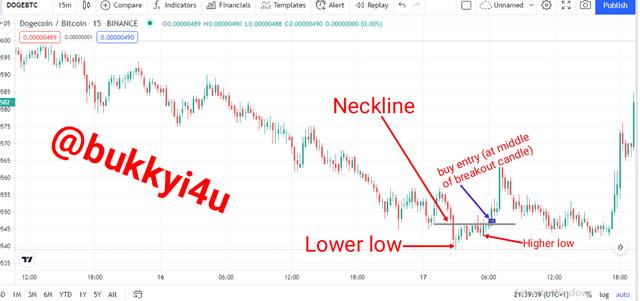
Setup In Downward Continuation
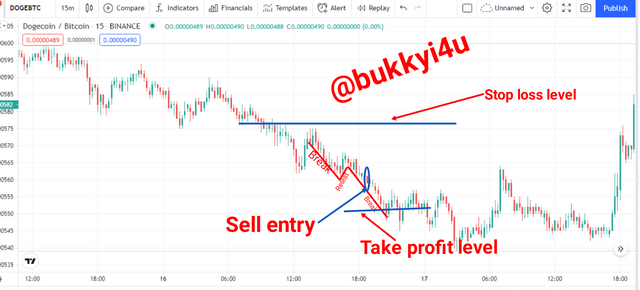
The DOGE/BTC 15 minute cut above shows the BRB setup to rightly trade the liquidity level at support in the case of continuation. It indicates the lower low made by the breakout pattern. Then it indicates the retest move and finally shows the breakout of the initial lower low. Finally, it shows the sell entry point together with the potential stop loss and take profit levels.
Setup In Reversal Of Downtrend
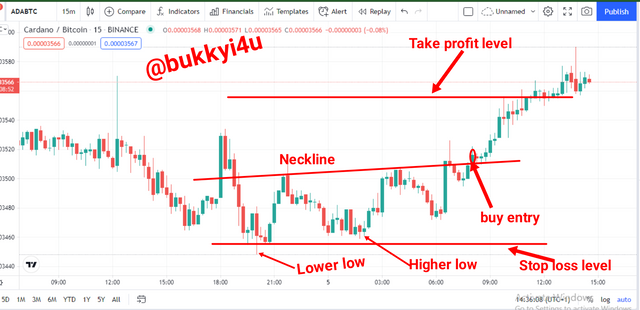
The image above of the ADA/BTC 15 minutes chart shows the MSB setup to rightfully trade the liquidity level in the reversal of a downtrend. It indicates the lower lows and the higher low created. Also it shows the neckline of price action and the buy entry point. Equally, it shows the stop loss and take profit orders.
CONCLUSION
- The liquidity levels constitute very strategic zones in the cryptocurrency market where most of the market orders get filled
- However, these liquidity levels could become induced traps set by institutional traders and knowing how to trade such levels correctly is a necessity
- In the case of reversals at liquidity levels the MSB strategy can be of help
- In the case where market breaks the liquidity levels and creates a trend continuation you can use the BRB strategy to confirm a possible trade entry
- These two strategies can be necessary and very helpful in making you avoid the induced trap of institutional traders like hedge funds and banks
(Unless otherwise indicated, all screenshots are taken from Trading view)