Steemit Crypto Academy / Season 3 / Week 4 / Advanced Homework Submitted To Professor @cryptokraze : Trading The Dynamic Support & Resistance / By @bukkyi4u
INTRODUCTION
In the study of key resistance and support levels a pattern usually indicates that such levels will most often appear horizontal in nature. In another way such key levels may not be horizontal but appeared to be dynamic or evolving. These areas of dynamic support and resistance in cryptocurrency markets refer to the places where the price of a crypto asset encounters a pullback into and experiences momentary support or resistance without such places actually having to act as the horizontal support or resistance levels in the market.
This would often happen for some reasons. First, the cryptocurrency market is an evolving one. This means that the interest of buyers and sellers can change momentarily in a way that was not pre-designed. So, such price pullbacks could occur at un-predetermined levels. Again, trends are often followed by dynamic momentum that equally comes with ever-changing order flows. Generally, while the static resistance and support levels are not seen to be moving and are always horizontal, the dynamic resistance and support levels are always observed to be moving and may not necessarily leave horizontal patterns.
DYNAMIC SUPPORT AND RESISTANCE FROM CRYPTO ASSETS CHARTS
These dynamic support and resistance levels from cryptocurrency price charts can often be identified with the use of Exponential Moving Averages (EMAs). However, the EMAs that should be used should be those that can be seen as being balanced in nature. Such EMAs should be able to track and give more relevance to the last closing prices of the candles for the period within which they are calculated.
These exponential moving averages are said to be balanced in that they do a great work in keeping track of the most recent market momentum and changes in price movement and equally factor in the price movements of the asset in the longer term. Therefore, they seem to act well in between - hence, balanced in nature.
Dynamic Support With 50 And 100 Periods EMAs

When the market is in an uptrend the 50 and 100 Periods EMAs can be combined to indicate important areas of dynamic support. In this case, as shown in the image above, the 100 Period EMA is below the 50 Period EMA and the price action oscillates above the two EMAs. The EMA works to identify important areas of dynamic support in the places where the price pull's back below the 50 Period EMA but does not go below the 100 Period EMA. Instead it returns from the pullback it has made in between the two EMAs.
Dynamic Resistance With 50 And 100 Periods EMAs

In the case of a downtrend the 50 and 100 Periods EMAs can still be combined to identify the key areas of important dynamic resistance. In this case the 100 Periods EMA is above the 50 Period EMA and the price action oscillates below the two EMAs. Occasionally, as the price journeys downwards it would make pullbacks that go above the 50 Period EMA but which do not go above the 100 Period EMA. Instead, it returns from the pullback and continues in the original direction. In this way, it creates important areas of dynamic resistance with such areas of pullback.

THE 8 PERIOD AND 20 PERIOD EMAS FOR DYNAMIC SUPPORT AND RESISTANCE
Actually, so many traders have discovered that different Periods EMAs can be combined to identify key areas of support and resistance in the trading of the dynamic support and resistance strategy. What is important is that price actually respects the EMAs (that is, does not break away from them). Sometimes, price might actually break away from these EMAs but what is important in identifying the places that can be referred to as dynamic support or resistance is that the EMAs are not static in such places but do actually respond to the dynamism of the price action.
To that effect, apart from the 50 and 100 Periods EMAs we have studied which were given by professor @cryptokraze, some other EMAs have been combined successfully with this strategy. Two of such other EMAs are the 8 Period and 20 Period EMAs (especially for scalping in shorter time frames).
Dynamic Support With 8 And 20 Periods EMAs

The 8 and 20 Periods EMAs can be used to identify important areas of dynamic support in an uptrending crypto market. In this case, as shown above, the 20 Period EMA is below the 8 Period EMA and the price action oscillates above the two EMAs. Occasionally, the price action would make pullbacks below the 8 Period EMA but does not go below the 20 Period EMA. Then, it makes a comeback and returns above the 8 Period EMA. In this way such areas of pullback can be identified as areas of dynamic support.
Dynamic Resistance With 8 And 20 Periods EMAs
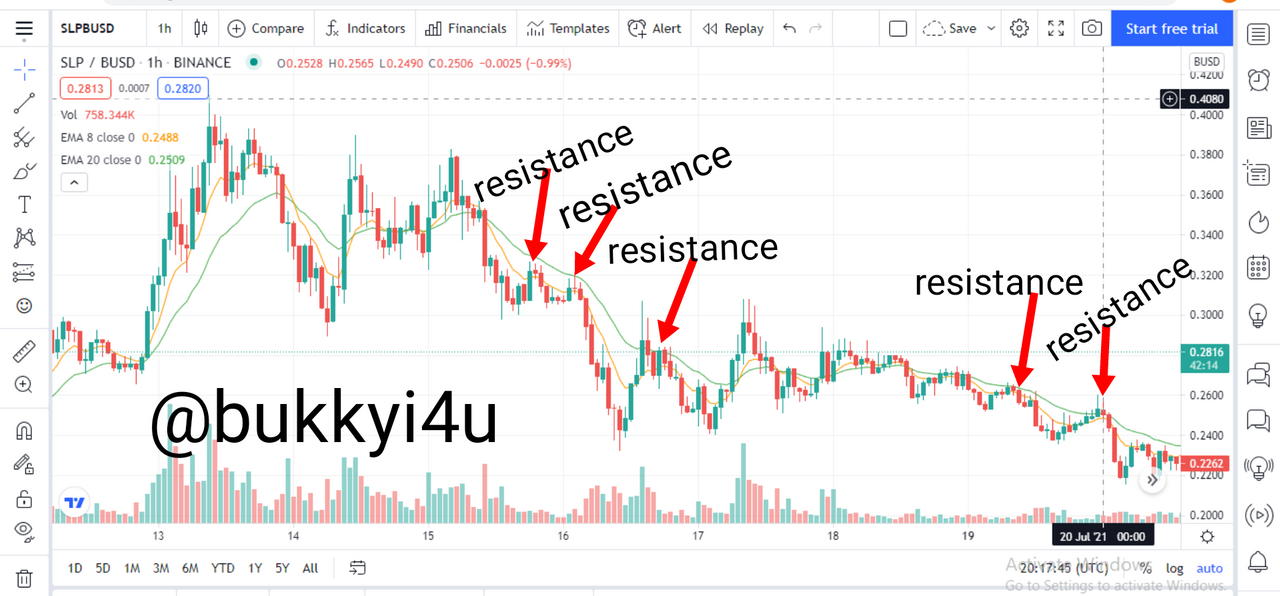
The 8 and 20 Periods EMAs can also be used to identify key areas of dynamic resistance in a downtrending crypto market. In this case, as shown above, the 20 Period EMA is above the 8 Period EMA and the price action oscillates below the two EMAs. Occasionally, as the price journeys downwards it would make pullbacks and go above the 8 Period EMA but does not go above the 20 Period EMA. Instead it respects this second EMA and returns below the 8 Period EMA. In this way, it leaves an important area of dynamic resistance with such pullbacks.
ENTRY CRITERIA WITH DYNAMIC SUPPORT AND RESISTANCE
Traders of the cryptocurrency market have learnt a strategy in combining two different periods EMAs to trade the dynamic support and resistance. However, to make entries with the dynamic support and resistance combining two different periods EMAs, there are some criteria that have to be fulfilled.
The Buy Entry

In the case of an uptrending market that has been marked with dynamic support you should follow the succeeding criteria in making an entry:
- You should add the 50 and 100 Periods EMAs to the price chart
- You should check to ensure that the price is trading above the two EMAs. This is necessary to validate the buy setup.
- You should then patiently wait for the price to touch on the 50 Period EMA or go below it. This is not time to enter.
- Also, the price is not expected to go below the 100 Period EMA
- You should wait for the price which has touched on or crossed below the 50 Period EMA to turn back again
- As the price of the crypto journeys back above the 50 Period EMA the buy entry can be taken immediately the 50 Period EMA is crossed
The Sell Entry

In the case of a downtrending market that has been marked with dynamic resistance you should follow the criteria below to make an entry:
- Add the 50 and 100 Periods EMAs to the crypto price chart.
- Ensure to check that the price is trading below the two EMAs
- Patiently wait for the price to touch on or go above the 50 Period EMA. Do not sell short yet.
- The price is not expected to go above the 100 Period EMA
- Patiently wait for the price that has touched on or crossed the 50 Period EMA to turn back and prepare to move below it again.
- The moment the price marks a point below the 50 Period EMA again after crossing it validates the setup and you can short the market or make a sell entry there
It should be noted that these entry criteria can still be obtained from the combination of other EMAs apart from the 50 and 100 Periods EMAs.
EXIT CRITERIA WITH DYNAMIC SUPPORT AND RESISTANCE
It is important to set take profit levels as well as stop loss levels. In Binance you can use an OCO order to set a limit order for your take profit while equally setting a stop-limit order to manage the risk and exit early in an unfavorable market.
Buy Exit In Profit

The following criteria can be followed in exiting a buy trade in profit:
- You should set a take profit level above your buy entry point in case the market continues in your desired direction
- You can check the chart on a higher time frame to determine the key resistance level in a preceding higher uptrend
- You can place your take profit level with that previous resistance level in mind
- The take profit level can be placed points above your entry level in a 1:1 RR (Risk:Reward) ratio to your stop loss. This means that your take profit should be exactly the same points above your entry point as the stop-loss order is below your entry point.
- If your take profit level is reached you should exit the trade or book your profits.
Buy Exit In Loss

You can follow the criteria below in exiting a buy trade in loss:
- You should set a stop loss order below your entry point in case the market goes against you
- The stop loss order should be placed below the 100 Period EMA
- The stop loss order should be placed in a 1:1 RR (Risk:Reward) ratio with the take profit order, meaning that it should be placed exactly the same points below the entry level as the take profit order is placed above this same entry level.
- You shouldn't set your stop loss too close to the entry point to avoid exiting the market prematurely
- Your stop loss order being hit would invalidate the setup
- If your stop loss order is reached you should exit the trade.
Sell Exit In Profit

You can set your take profit level in a sell trade with the following criteria in mind:
- You should set a take profit level below your sell entry point in case the price continues in your desired direction
- You can move up a higher time frame on the price chart to determine a lower support level from the preceding lower downtrend
- The take profit level should be set in a 1:1 RR (Risk:Reward) ratio with the stop loss order, meaning that it has to be points below the entry that is exactly the same as the points with which the stop loss order is above the sell entry
- If the take profit level is reached you can book your profits or decide to exit entirely
Sell Exit In Loss

A stop loss order should be set to manage risk in case prices do not continue in our desired direction. The criteria below can be followed:
- You should set a stop loss order above your entry point in case the market goes against you
- The stop-loss order should be set above the 100 Period EMA
- The stop loss order should be placed in a 1:1 RR (Risk:Reward) ratio meaning that it should be points above your entry level as the take profit level is below the same entry point
- You shouldn't set your stop loss order too close to the trade entry point to avoid exiting prematurely
- Your stop loss order being hit invalidates the setup
- If your stop loss order is hit you should exit the trade
REAL BUY TRADE WITH DYNAMIC SUPPORT FROM ADA/BTC CHART
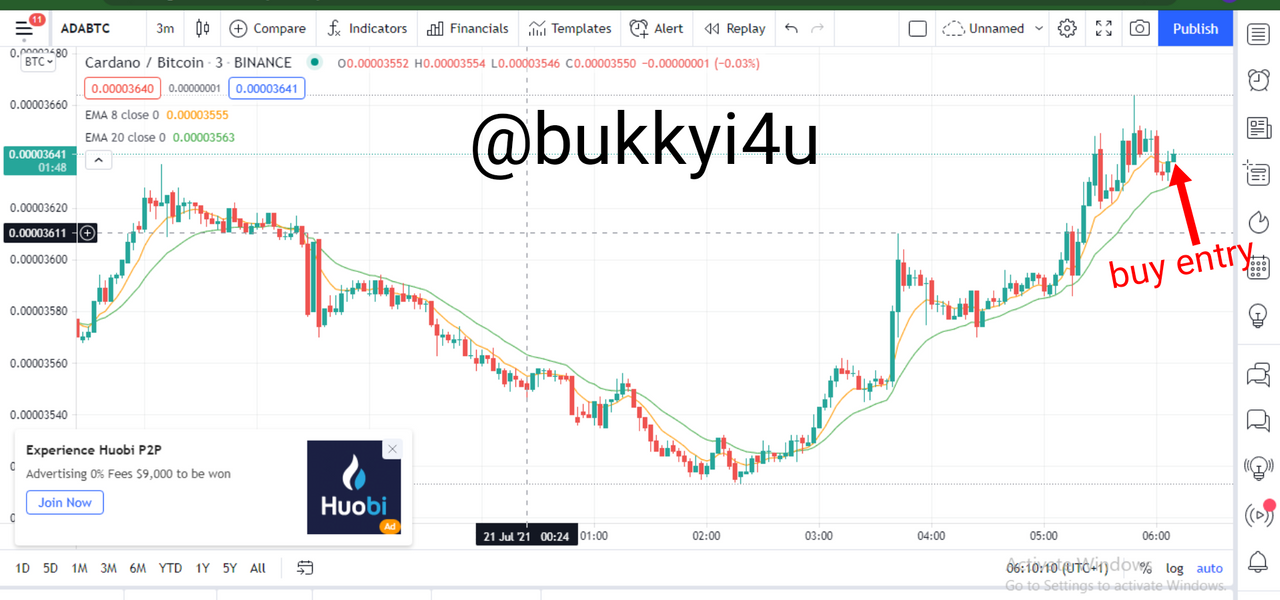
The price chart above displays a real trade I carried out on ADA/BTC pair with the knowledge of dynamic support. I used the 8 and 20 Period EMAs in this particular trade. In the price chart above the price action moves below the 8 Period EMA and makes a comeback. In this comeback, it immediately crosses above the 8 Period EMA and I take my buy entry at that particular point of cross.
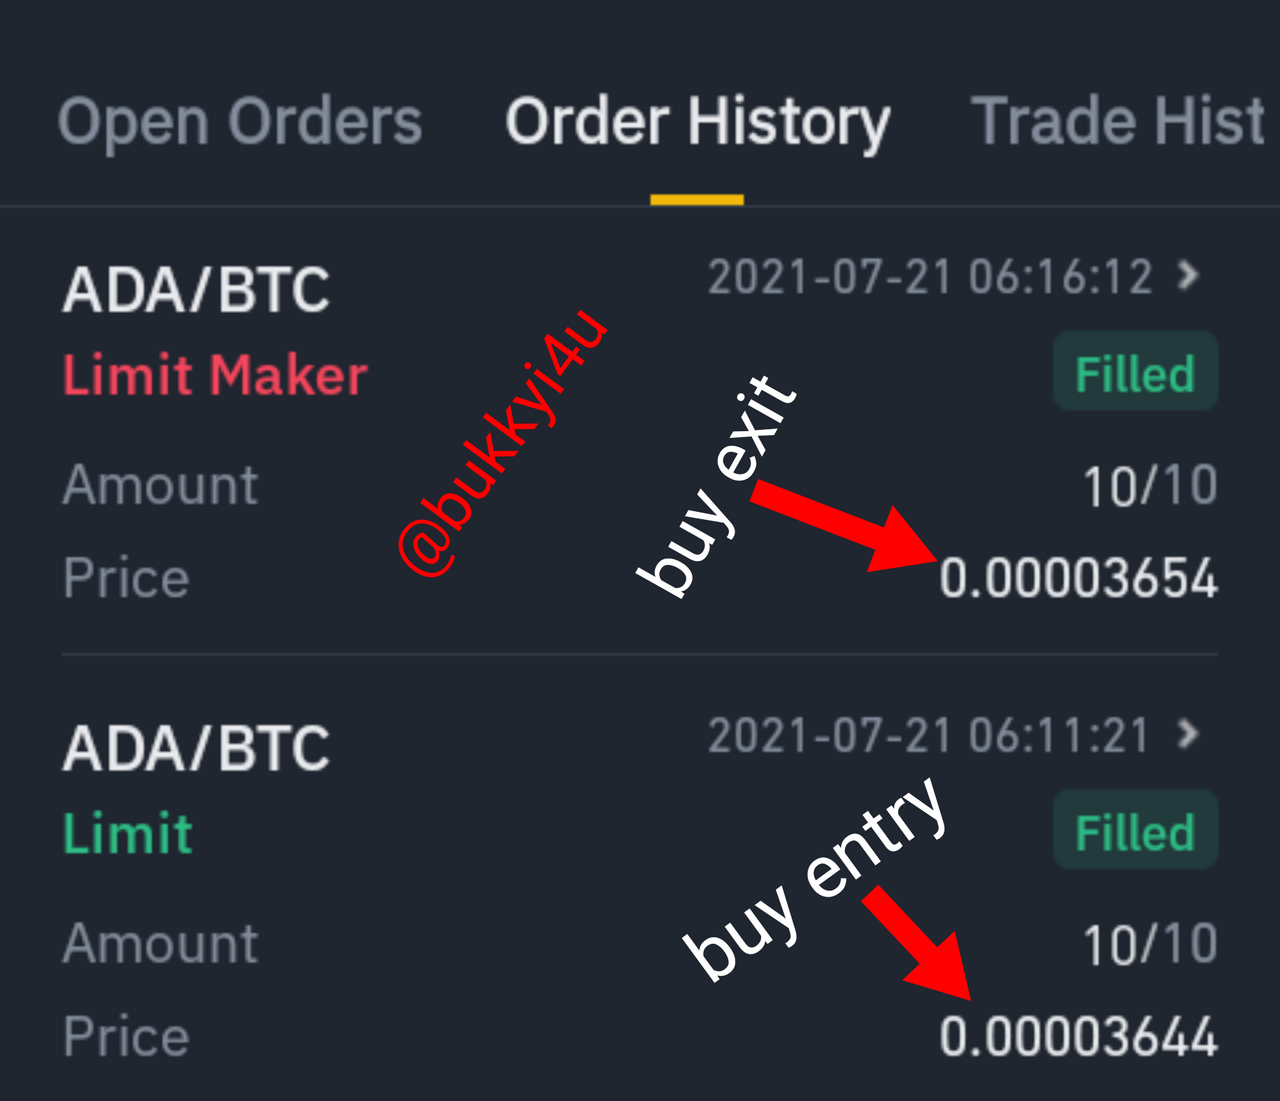
From the image above I made this entry at 0.00003644. The price trend continued in my desired direction to fill my take profit level at 0.00003654. Equally, I had set my stop loss at 0.00003634 which is the same 10 points below my entry point as the take profit is above the same entry point.
REAL SELL TRADE WITH DYNAMIC RESISTANCE FROM ATM/USDT

The price chart above displays a real sell trade I performed on the ATM/USDT pair with the knowledge of dynamic resistance. I used the 8 and 20 Period EMAs for this particular trade. The Price had made a pullback above the 8 Period EMA but didn't get past the 20 Period EMA. Immediately the price makes a comeback and continues in its original direction. I took my sell entry the moment it crossed below the 8 Period EMA again.

From the image above I made this entry at 10.856. The price continued in my desired direction to fill my take profit order at 10.802. Equally, I had set my stop loss order at 10.910 which is the same 54 points above my entry point as my profit level is below the same entry point.
CONCLUSION
- The use of EMAs is very instrumental in identifying key areas of dynamic support and resistance from cryptocurrency price charts
- With the dynamic support and resistance in place you should be able to identify early enough important entry points that can help you to trade in the continuation of the trend
- However, before making an entry with the dynamic support and resistance strategy there are very important criteria that should be followed
- Equally, there are important criteria that should be observed to understand how to properly exit the market in profit and also manage risk and exit early in loss
- The dynamic support and resistance can be traded on any time frame. However, while researching on this assignment I discovered that shorter time frames would always come with more opportunities but need decisive trading actions.
- The 50 and 100 Periods EMAs are very good for this strategy. All the same, other EMAs such as the 8 and 20 Period EMAs are also good, especially in shorter time frames.
Dear @bukkyi4u
Thank you for participating in Steemit Crypto Academy Season 03 and making efforts to complete the homework task. You got 9.5/10 Grade Points according to the following Scale;
Key Notes:
*.You have shown good understanding of the strategy by making precise charts for different elements of the strategy.
We appreciate your efforts in Crypto academy and look forward for your next homework tasks.
Regards
@cryptokraze