How to Trade Cryptocurrencies Profitably Using TD Sequential -Steemit Crypto Academy | S4W8 | Homework Post for @reddileep

Edited with Canva

1- Define TD Sequential Indicator in your own words.

One of the very interesting indicators introduced by DeMark is known as the TD Sequential indicator. Of all the different DeMark indicators I have come across, the TD Sequential indicator is of great interest to me because it is able to identify trading opportunities when the market is trending and also indicate the bias of the underlying momentum of the price action. Interestingly, it makes use of the TV Setup psychology to identify momentum while identifying a trending market by use of the TD Countdown psychology which are also the two different components of the indicator. Furthermore, the indicator can be applied to any time frame no matter the volatility in the underlying market even without changing the default settings of the indicator. This is because the indicator is based on the relative price action of an asset and incorporates very objective and disciplined rules for money management in its strategies as propounded through the dint of trial and error by its creator, Tom DeMark, in the 1970s.
Even for a trader who is not very good with technical indicators the TD Sequential indicator is designed in such a way that it can help you time the market as a tool which can function in adjunct to the tools which you already use for trading. This is because the dynamics of the indicator are useful in identifying exit points of take profit to help you not to rely on less efficient indicators of possible price reversal that may close you out of a profitable trade earlier or later by making you not exit at a top or bottom.
It is amazing to know that the TD sequential works in generating the signals and highlighting the necessary points where you should not be adding up to your already existing positions in the already identified direction of the market trend. This means that the TD Sequential indicator can be very good in helping you fade out the trends and identifying the exact points of possible reversal. It is a quite versatile tool and comes with two components: the TD Setup and the TD Countdown. While the TD Setup makes use of momentum to identify the possible price ranges, it relies on the TD Countdown as a trend based indicator which can be used to fade out the already existing direction of the market with low risk of being wrong.
Most people have learnt to simply follow the trends in the market hence it is said that the trend is your friend as a very popular trading mantra. In this regard, the TD Sequential indicator tries to identify point ranges of the price action where exhaustion of price is prospective as a way of trying to anticipate possible tops and bottoms in the market in such times when prices are anticipated or thought to either be in oversold or overbought regions or at such other times in the market when the underlying market sentiment is invariably determined or believed to have reached an extreme.
The TD Sequential indicator can be useful as a momentum indicator. However, it bears some more striking advantages than conventional momentum indicators. For instance, consider a more conventional momentum indicator like the RSI which is usually calibrated between 100 and 0 with overbought and oversold zones which are fixed thereby making them less reliable in identifying the exact time that the market switches its trend. A situation whereby the market is in a strong uptrend, the RSI cannot pull back into an extreme oversold region which should be around 30. Rather, it would find some support around the 50 or 40 marks.
Equally, in a strong downtrend it cannot retrace into extreme overbought regions which always sits around 70 or 75. Instead when the market makes a pullback in a strong downtrend it only finds oscillatory resistance around marks 50 and 60. On the other hand, the TD sequential indicator dynamically adjusts itself in line with the action of the price movement. This is because the indicator usually recalculates what it would understand to be the extremes in price range produced by the price action. Usually, these dynamic adjustments can be seen as what is called the TDST levels and identifiable when a new TD Setup is completed.
This is just one out of the many efficient uses and application of the TD Sequential indicator which interests me most.

2- Explain the Psychology behind TD Sequential. (Screenshots required)

The TD Sequential is able to identify where a turning point could occur in the price trend of a crypto asset. Usually, it could occur on any time frame. When the price trend of an asset indicates nine candles consecutively closing above or below the closures of four previous candles it produces a TD9.
While some indicators might perform well in a trending market and poorly in a ranging market, the TD Sequential is designed to solve that problem. This is because it comes with two concepts that are essential in helping us determine good trading opportunities in both types of market. Amazingly, these two concepts constitute the psychology behind the indicator and can all occur for both buy or sell scenarios. They include:-
- The TD Setup
- The TD Countdown
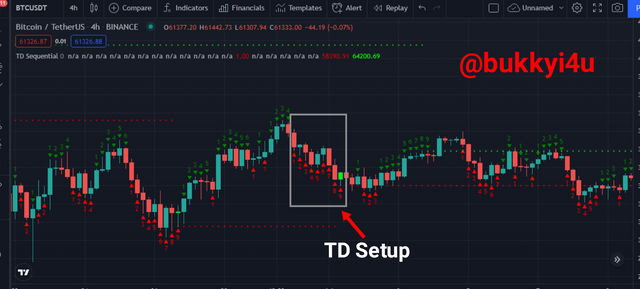
Usually, a TD Setup has to be completed before a TD Countdown can come into place. The TD Setup as the momentum indicator of the TD Sequential trading system makes it possible for traders to have a consistent approach that is workable even in ranging markets. With the use of the TD Setup, it is possible for traders to optimally enter short or long positions when the market is in ranging conditions. Again, it makes it possible for traders to be able to understand when the price is about to enter into a range. Equally, it helps such traders to determine the resistance or ceiling levels and support or floor levels in the trading range conditions and makes it possible for traders to properly manage their trades by informing them on important areas to set stop-loss orders.
Source
The TD countdown itself has to do with 13 counts and not 9 counts as in the TD Setup. In this case, rather than counting backwards up to the fourth candle behind the current candle whose close we are considering we just have to count backwards by two candles. Hence, we would start printing number one for the TD Countdown if the current candle close is either above or below the close of the second candle behind it. We would count successively up to the 13th bar and record it as a possible reversal or correction of the current trend.
The TD Setup can be a TD Buy Setup where the DeMark count occurs when prices are in a downtrend. When the DeMark count occurs in an uptrend a TD Sell Setup is created. It is also the same with the TD Countdown as both TD Buy Countdown and TD Sell Countdown can be created.

3- Explain the TD Setup during a bullish and a bearish market. (Screenshots required)

The TD Setup can come in two types as has already been said. There is the scenario for the TD Buy Setup and there is equally another scenario for the TD Sell Setup. Both will be explained.
TD Buy Setup
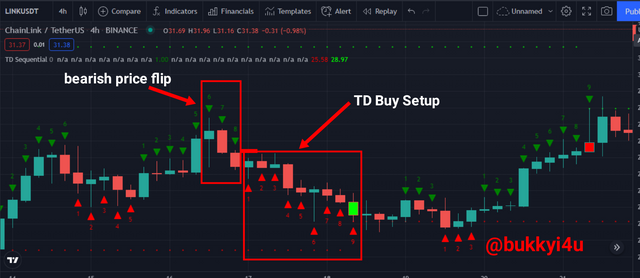
Normally, a TD Buy setup would start with a bearish price flip. This represents a switch from a bullish momentum to a bearish momentum thereby presenting the buy signal from the TD Sequential indicator. This could seem complicated at first but it doesn't have to be so. The bearish price flip usually occurs when a candle that is trading at a price that is higher than the close of the previous candles is formed.
TD Buy Setup
Source
The TD Buy Setup would normally start with a bearish price flip which switches the momentum from bullish to bearish. In the price chart above, the green arrow Candles 6, 7 and 8 give us this bearish price flip needed. The green arrow candle 6 closes above the four previous candles. Suddenly, green arrow candles 7 and 8 begin to close below the previous candles thereby providing the bearish price flip. From the next candle we would begin to print red arrow candle 1 which begins the buy setup.
Once the bullish momentum had shifted to a bearish momentum, the first red arrow candle 1 - which closes lower than its corresponding fourth earlier candle which is green arrow candle 5 before it - was initiated after the bearish price flip. This represents the first count of our expected 9 count TD buy setup. In this count we would be concentrating on the close of the current candle in relation to the close of the fourth candle before it. We are expecting nine consecutive candles to close below the fourth candle before it in a corresponding relation to each of these consecutive 9 candles.
The red arrow candle two which is the second in the nine count of the buy setup closes below the fourth candle which occurs before it, that is, below green arrow candle 6.
This sequence which must be consecutive with the bar of the succeeding next count in the nine counts of the buy Setup closing below the fourth bar which occurred before it. The current TD buy setup would be interrupted or terminated if any of the bars should close higher than the fourth bar which occurred earlier than it.
If other indicators are supportive of a possible reversal then you should hope to initiate a buy trade either with the ninth bar or somewhere after the 9th bar of the buy setup has been printed

TD Sell Setup
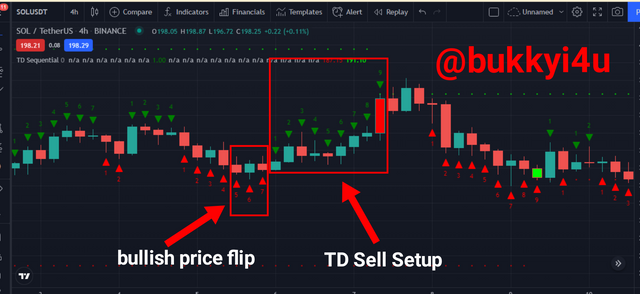
Usually, a TD Sell Setup would begin with a bullish price flip. This represents a switch from a bearish momentum to a bullish momentum thereby presenting the sell signal from the TD sequential indicator. Initially, it may seem complicated to identify but it is not meant to be so. The bullish price flip usually occurs when a candle that is trading at a price which is lower than the close of the previous candles is formed.
TD Sell Setup
Source
As has been said, the TD Sell Setup would normally begin with a bullish price flip which switches the momentum from bearish to bullish. In the price chart above the red arrow candles 5, 6 and 7 give us this bullish price flip needed. The red arrow candle 5 closes below the four previous candles. Suddenly red arrow candles 6 and 7 begin to close above the previous candles thereby providing the bullish price flip. From the next candle we would begin by printing green arrow candle 1 which begins the Sell Setup.
Once the bearish momentum had shifted to a bullish momentum, the first green arrow candle 1 - which closes higher than its corresponding fourth earlier candle which is the green arrow candle 4 before it - was initiated after the bullish price flip. This represents the first camp of our expected 9 count TD Setup. In this count would be concentrating on the close of the current candle in relation to the close of the fourth candle before it. We are expecting nine consecutive candles to close above The fourth candle before them in a corresponding relation to each of these consecutive nine candles.
The green arrow candle 2 which is the second in the nine count of this Sell Setup closes above the fourth candle that occurs before it - that is, above red arrow candle 5.
This sequence must be consecutive with the bar of the succeeding count in the nine counts of the Sell Setup closing above the fourth bar which occurred before it. The current TD Sell Setup would be interrupted or terminated if any of the bars should close lower than the fourth bar which occurred earlier than it.
If other indicators are supportive of a possible downard reversal, then you should hope to initiate a sell trade either with the ninth bar or somewhere after the ninth bar of the sell setup has been printed.

4- Graphically explain how to identify a trend reversal using TD Sequential Indicator in a chart. (Screenshots required)

In the TD Sequential Indicator, the TD setup can inform a possible reversal of a current trend. Furthermore, the TD countdown can equally provide a good signal for trend exhaustion in which case the current trend is fading out and giving way to a trend in the opposite direction. In the TD setup it is always understood that the 8th and 9th counts in the direction of the setup provides signals for over extension of a current price action or market trend.
In this section I would be exploring the TD Setup Perfection as a reversal pattern. In most cases people would simply move from the TD Setup to the TD Countdown. However, this shouldn't be so as it is important to consider the implications of a completed Setup. This means it may not just have to stop with either buying or selling on the 9th count. Usually, a reversal could possibly be confirmed.
Source
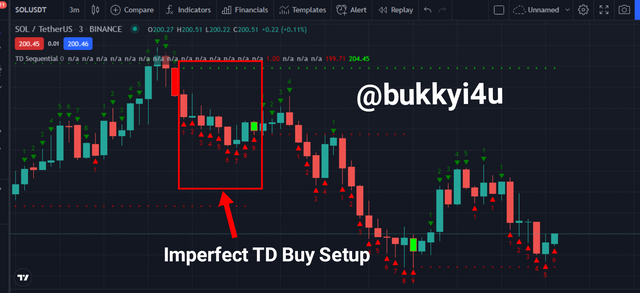
The TD Setup Perfection is a very good reversal pattern and is formed when, for instance, in the TD buy setup scenario, bars 8 and 9 form lows which are actually less than or equal to the lows which bars 6 and 7 created. In the indicator when 9 is actually perfected it usually appears opaque.
In the case of a TD Sell Setup Perfection, we should be hoping to see the highs of bars 8 and 9 to be higher than the highs created by bars 6 and 7 respectively. If on the other hand the bars of candles 8 and 9 do not close higher than the bars of candles 6 and 7 respectively the perfection would not be completed and we wouldn't want to take that as a potential reversal signal.
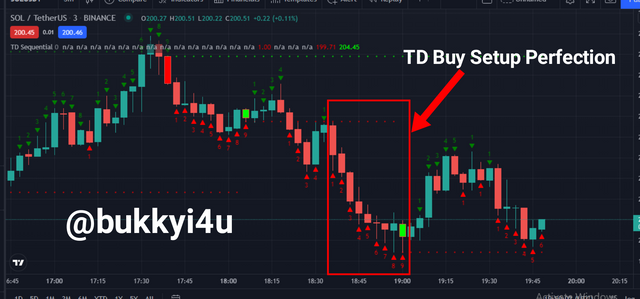
Source
The reason we would want to ensure that the bars of 8 and 9 close higher than 6 and 7 - for buy setup - is because if the bars of 8 and 9 do not close higher, then there is the likelihood that price would want to retest the highs of 6 and 7 before forming a sort of consolidation or reversal. However, a perfected TD Setup gives a potential hint of a strong reversal imminently. So, a very good way of detecting trend strength exhaustion and imminent reversal is with the use of the TD Setup Perfection.

5- Using the knowledge gained from previous lessons, do a better Technical Analysis combining TD Sequential Indicator and make a real purchase of a coin at a point in which TD 9 or 8 count occurs. Then sell it before the next resistance line. (You should demonstrate all the relevant details including entry point, exit point, resistance lines, support lines or any other trading pattern such as Double bottom, Falling wedge and Inverse Head and Shoulders patterns.)

I discovered that on the SOL/USDT price chart under the 3 minute time frame, a perfect buy setup had been formed. So, I intended to enter a long position with the tradingview paper trading but I have to first study the overall trend or chart pattern as a way of making a better technical analysis.
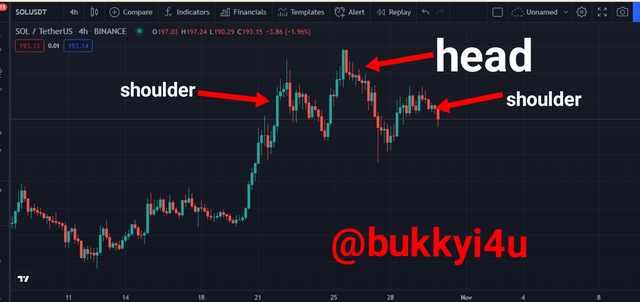
Source
From the chart pattern above it is clear on the 4 hour time frame that the SOL/USDT has formed a head and shoulders pattern. The head pattern had gotten as high as $218.93 on the 25th of October around 13 oclock UTC + 1. The first shoulder had gotten as high as $215.10 on the 22nd of October 2021 around 13:00 clock UTC + 1.
Currently, the second shoulder which is trying to retest the high created by the head is already forming. However, it seems to be meeting a strong opposition at the moment at the resistance and had only gotten as high as $205.22 on the 29th of October 2021 around 1:00 UTC + 1.
Actually, this chart pattern portends a bullish to bearish reversal. So, I do not intend to trade the buy setup for a long time. However, since a good buy setup of the TD has been formed I have to enter long on the one minute time frame and hope to exit before the next resistance under the 3 minutes time.
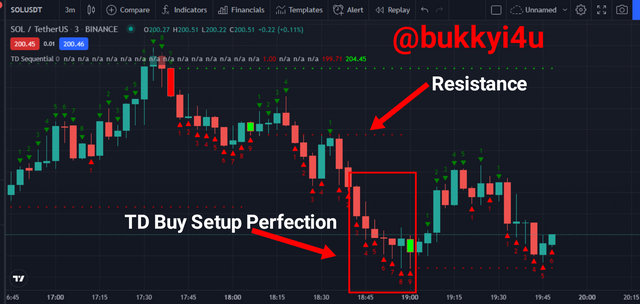
Source
From the 3 minute chart above you would see that a TD buy Setup Perfection has been created and this coincided with the opaque nine count. At that point where the perfected 9 count was formed I entered a long position at $200.40. This is shown below:

Source
I set a stop loss at 199.24 about (0.58% risk) and put my take profit before the next resistance at $202.35 which is about 1% reward.
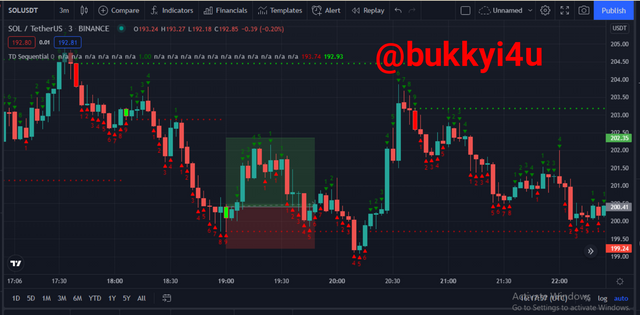
Source
After a while the price had actually reversed and continued moving towards the resistance but got midway and started consolidating. I had to sell it off here at $201.56 with a $2.66 profit.

Source

Source

CONCLUSION

The TD Sequential indicator is a very good design that can be used in adjunct with other efficient trading indicators to generate signals to portend potential trend exhaustion and imminent reversal. It works very well in indicating momentum more than other traditional momentum indicators because it follows price closely and can even inform of the exact point of potential price reversal.
The TD Sequential works with the two important psychology of the TD Setup and TD countdown. While the TD Setup is based on nine counts, the TD Countdown is actually based on 13 counts. It is important to learn how the TD Setup works in a bullish trend and how it works in a bearish trend as a way of trying to understand how to use it to either identify potential trend reversals or an imminent consolidation or ranging condition of price action.
