Introduction to the Principles of Crypto Analysis - Crypto Academy S4W7 - Homework Post for @imagen

What are the differences between Fundamental Analysis and Technical Analysis? Which one is used most often?

Here is a quick rundown of what both types of analysis involve:
Fundamental analysis is used to evaluate the intrinsic value of the asset. The analysis is done by considering internal, and external, or public information about the stock or asset. Fundamental analysis involves carrying out a background check about a project, the people involve in order to minimize the risk of getting scammed.
A fundamental analyst study’s both past and present data about a project to predict the future value of the stock or asset. Fundamental analysis is a useful tool for making long-term trading decisions for long-term traders.
Technical Analysis
It involves the understanding of price patterns to make trading decisions. Traders study candlestick charts, and with the help of trend lines and other indicators predict future price movement or patterns. Traders evaluate the market by studying its behavior in the past and predicting how it will behave in the future.
It is often used by short-term traders since it is quite effective for making short-term trading decisions. With the above in mind, what are the key areas in which fundamental analysis differs from the technical analysis?
| Criteria | Fundamental Analysis | Technical Analysis |
|---|---|---|
| Value assessed | Intrinsic/innate value | Future/prospective value |
| Considerations | Available Information on asset | Past price movements |
| Applications | Favoured by long-term traders (investment-driven) | Favoured by spot traders (trading driven) |
| Risk of scam/rug pulls | Very low | Very high |
| Time focus | Past and present information | Past information |
The Most often Used Analysis
It is clearly evident that technical analysis is the most often used type of analysis. The use of technical analysis is evident as we see traders manipulating several indicators to help them have a grasp of the market. Here are some reasons why technical analysis trumps fundamental analysis in terms of adoption:
Fundamental analysis is usually a one-off process with its impact spanning through time.
Technical analysis is always done to make active trading choices, while fundamental analysis are best required for passive (investment) choices.
Fundamental analysis may seem daunting to some as it involves a lot of studying and research.
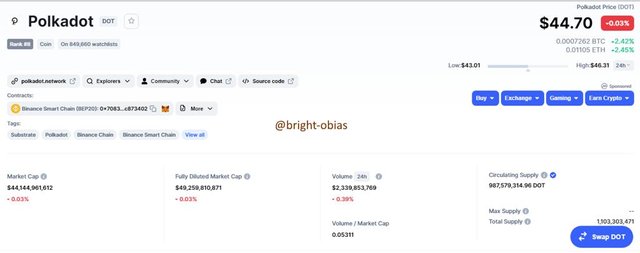
Fundamental analysis of Polkadot

Polkadot (DOT)
Polkadot (DOT) is a multi-chain protocol decentralize blockchain interoperability platform that enables the transfer of assets or token from one user to another. Through Polkadot, blockchains can communicate with each other, thus, enhancing scalability in the blockchain world.
This cryptocurrency platform was developed by Gavin Wood with efforts by the Web3 Foundation. Through the Polkadot platform, one can create a network of interconnected blockchains known as Parachains which enables a wide range of applications across several individualized blockchain projects.
Objective
One of the objectives of Polkadot is to create a platform where other blockchains can be created. It is also a platform that allows transactions of different types of assets and tokens between traders or users.
Financial Metrics
| Parameter | Value |
|---|---|
| Market Cap | $43,955,715,426 |
| Liquidity | Polkadot can be converted or exchanged or other assets or tokens. 1 DOT = $44.42 |
| Circulating supply | 1,041,869,961 DOT |
| Total supply | 1,103,303,471, DOT |
| Maximum supply | No Data |
On-Chain Metrics
| Parameter | Value |
|---|---|
| Number of transactions carried out | 1,000,000 transactions per second |
| Number of Wallets created | No data |
| Hash Rate | 5,164 |
| Volumes locked in Staking | 1000 |
| Volumes deposited in Exchanges | $536.62M |
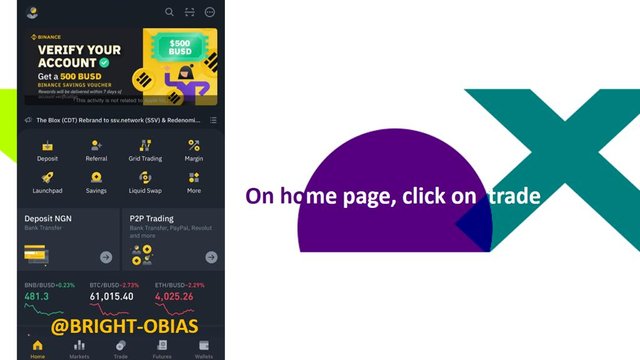
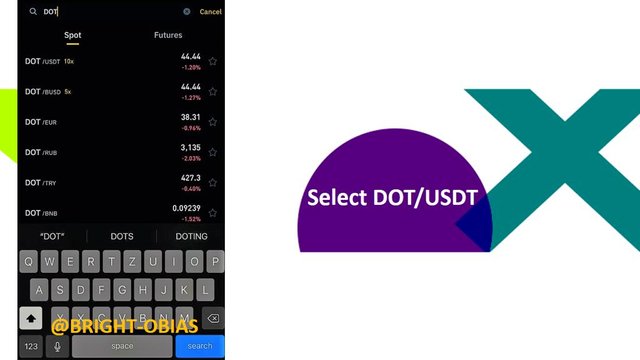
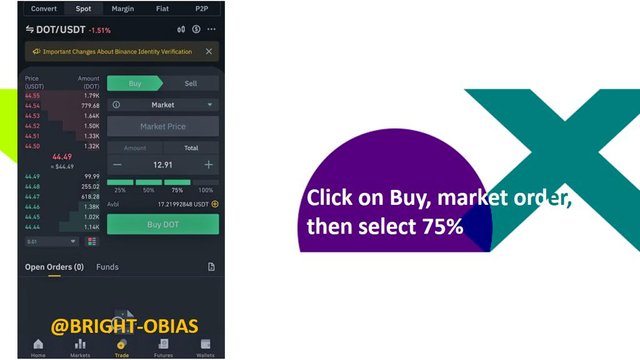
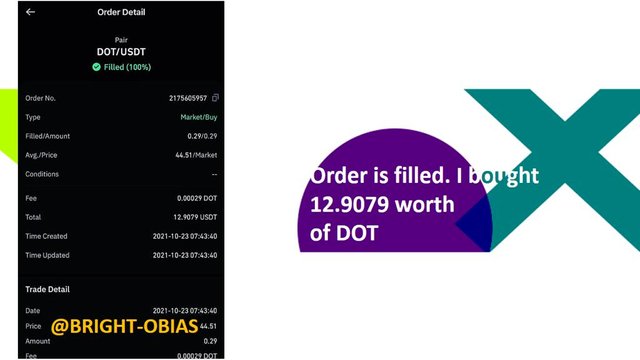
Make a purchase from your verified account of at least 10USDT of the currency selected in the previous point. Describe the process
I did the transaction using my verified Binance account. Below is the process.
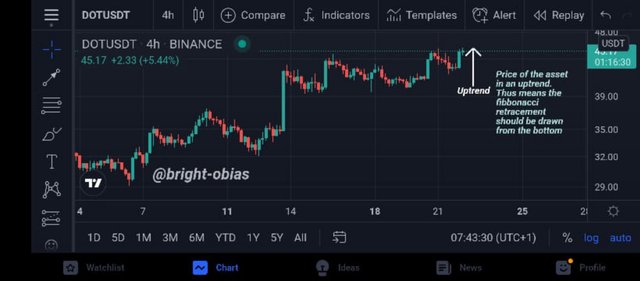
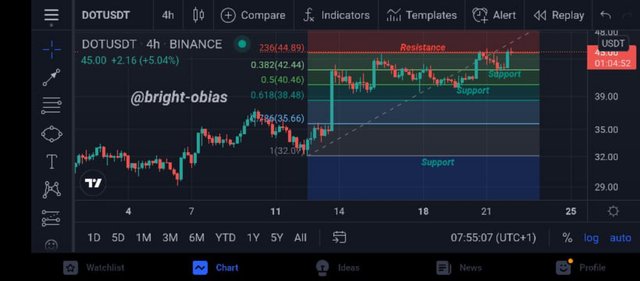
Apply Fibonacci Retracements to the previously selected asset with a 4hr time frame on the platform of your choice. Observe the evolution of the price at 24 and 48hrs, did it go up or down in value? Look to identify resistance and support levels.
I will be using my binance to demonstrate this. I first looked out for the trend of the market. I noticed it was in an uptrend.
The image below depicts the support and resistance points in the chart using Fibonacci retracement for 0hrs.
What are Bollinger Bands? How do they apply to Crypto Technical Analysis? With which other tool or indicator do you combine Bollinger Bands to analyze a Crypto?
Bollinger Band:
This is a chart formulated to determine the price and volatility of a market by calculating its standard deviation. It was developed by John Bollinger in order to help investors make trading decisions involving price actions. The Bollinger Bands consists of two lines, an upper and a lower band (line) and in the middle, there is a line showing the moving average.
Using the Bollinger Band for technical analysis:
The Bollinger Band is made up of two band lines and a middle line known as the moving average (MA). The upper line which is the upper band shows when a stock or asset is overbought signaling a possible reversal. The bottom or lower line which is the lower band shows when an asset is oversold indicating that there will likely be a reversal in the opposite direction. Traders use these signals to aid their decision making when trading.
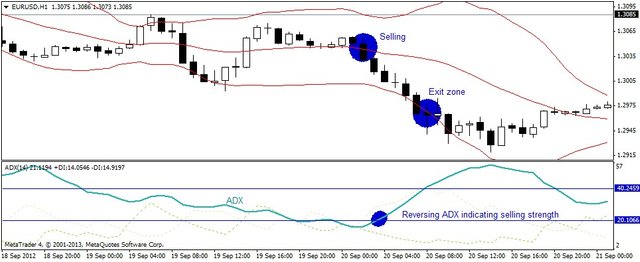
Using the Average Directional Index (ADX) as an auxiliary indicator:
The Average Directional Index (ADX) is a tool used by technical analyst to identify the strength of a trending market. It shows how strong or weak a trend is. An ADX is formed by combing a Positive Directional Indicator +DI and a Negative Directional Indicator -DI to evaluate the strength of a trending market.
Values of the ADX ranges from 0-100, a value of 0-20 ADX indicates that the trend of the market is weak proposing a reversal in the trend, values of 25-40 shows that the market is strong which means that there is a trend in the market and the market will continue the trend, consolidate or reverse, values of 40-100 shows that the trend of the market is extremely strong.
Traders use the ADX to confirm signals generated by the Bollinger bands. When the market is trending along the upper Bollinger band and the ADX is 20 or below, it shows that the trend is weak and there will likely be a reversal and this will act as a Sell signal for traders.
When the market is trending along or below the support line or lower Bollinger band it indicates that the stock or asset is oversold, to confirm this signal, traders will check the value of the ADX, if the value of the ADX is below 20 it shows that the trend is weak and there might be a reversal which will act as a buy signal.
But if the ADX value is 25 and above it shows that there is a trend and price might consolidate, reverse or continue trending in the same direction, (this also applies to an Up trending market) at this point some traders will decide to hold and wait for other trading opportunities.
Conclusion
The main aim of every trader before entering a trade is to maximize profit as well as to reduce losses. For this aim to be achieved a trader needs to put into consideration both technical and fundamental analysis.
Technical analysis tells us about past information of an asset with which we can use to make decision, either to invest in the asset or not, while fundamental analysis gives us general information behind the project of an asset as well as its future prospects. Special thanks to @imagen for the wonderful lecture.
Gracias por participar en la Cuarta Temporada de la Steemit Crypto Academy.
Continua esforzandote, espero seguir corrigiendo tus asignaciones.
Hello prof @imagen, I want to remind you that the voting window for this post is remaining just a day to close. No reward yet...
Cc
@steemcurator02
Please verify my Achievement 2. https://steemit.com/hive-172186/@michael71/achievement-2-basic-key-and-securities-in-steemit-by-michael71