[Support and Resistance Breakouts] - Crypto Academy / S6W3 - Homework post for professor @pelon53.
.png)
Introduction

In this section, we would be looking at support and resistance levels and also how to indicate them on crypto charts when trading. Let's define these two terms and then look at the advantages of indicating them on crypto charts before trading.
Support levels refer to the price area of an asset whereby the price of the asset can possibly reverse or bounce back to an uptrend after a fall in the price of the asset. Support levels are considered to be the region whereby buyers are preparing to enter into the market or go for a buy position.
Resistance levels refer to the price area of an asset whereby the price of the asset can possibly reverse or bounce back to a downtrend after a rise in the price of the asset. Resistance levels are considered to be the region whereby sellers are preparing to excite from the market or go for a sell position.
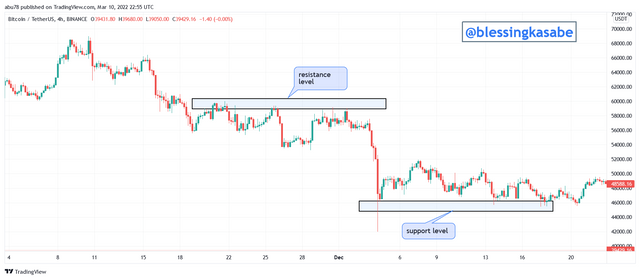
Support and resistance levels can be dynamic as well as static and I would elaborate more on that briefly. Static support and resistance levels are represented or indicated by horizontal lines on the crypto chart. On the other hand, dynamic support and resistance levels are represented or indicated by trendlines on the chart. The support and resistance levels are very useful for traders, especially in times of entering a trade. Support and resistance levels are taken to be entry and exit points in the crypto market respectively. It is good to know when to enter a trade and also when to exit from trade so as to maximize profits and avoid huge losses.
Due to the volatility and fluctuations in the price of assets, it is very advisable for traders to use support and resistance levels to their advantage in entering and exiting trades. This would help them to acquire more profit as well as maintain their trade capital.
For a resistance level, the forces of supply are observed to be higher and when that happens the price of the asset falls. The resistance level region indicates that buyers are leaving the market and sellers take charge of the market due to the increase of supply in the market.
Similarly, for a support level, the forces of demand are observed to be higher and when that happens the price of the asset rise. The support level region indicates that sellers are leaving the market and buyers take charge of the market due to the increase of demand in the market. Support and resistance levels help or guide traders in trading crypto assets.
Traders combine support and resistance levels to build trade sentiments as prices of assets are usually seen in reacting around the support and resistance levels. This helps to provide more information to traders so as to enter trade correctly.
In this section, we will be looking at the breakout of support and resistance including a screenshot from a crypto chart. We also identify a breakout using an indicator to filter it out.
Breaking of Support and Resistance:- whenever a support or resistance level is broken it is termed as a Breakout in crypto trading. Breakout is referred to an event that happens when the price of an asset closes below or above a support or resistance level respectively in trading. When that happens, it can either be an indication of a trend reversal or a continuation of the trend in the price of an asset. Mostly, the price of assets does trade within the area or region at any interval between the support and resistance levels and when this occurs, traders make good use of it in order to earn profits and avoid losses.
The Breakout of resistance takes place when the price of an asset crosses and close above a swing high point identified on the chart which indicates either a continuation of the bullish trend or a start of new a trend. I would explain two ways in which breakouts of resistance can take place below here in this article. The first one we would look at is the break of resistance and continuation.
Break of Resistance and Continuation:- for this event or occurrence, the price momentum of the asset is observed to be high and volatile and as such immediately the price of the asset breaks the resistance level, the uptrend continues without a retest to the previously broken resistance level. We will observe that the previously broken resistance will now become the support level of the new price movement. I would demonstrate a good example here using the crypto chart as an example.
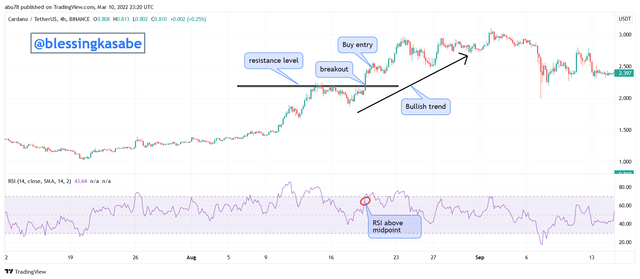
From the chart shown above, we can see that I used the RSI indicator to identify the resistance breakout. We can clearly see that the RSI indicator crossed above the midpoint (50) indicating that the price of the asset is in a potential bullish trend movement. The price of the asset then breaks the resistance level with high momentum and volume as we can see above from the screenshot taken. We can also see that the bullish movement of the price of the asset continued without any retest on the broken resistance level due to the high momentum in the price movement of the asset.
A buy entry can be executed after observing two bullish candles formation by placing take profit aiming at the previous high point of the price movement of the asset. Also, stop loss should be placed below the resistance level.
Break and Retest of Resistance Zone:- another way resistance breakout occurs is the break and retest of the resistance zone. In this scenario, the price of the asset breaks the resistance level and then later pulls back and retests the broken resistance level (new support level for the uptrend). After the retest, the price of the asset then continues in the uptrend movement. A good illustration is indicated below here in this article.
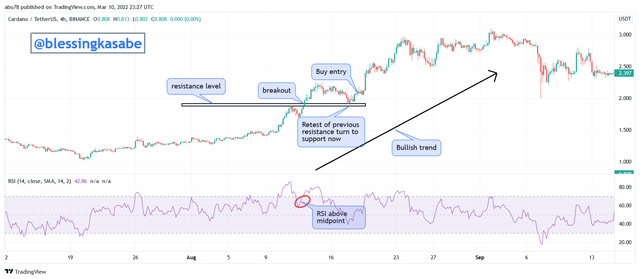
From the chart shown above, we can see that I used the RSI indicator to identify the resistance breakout. We can clearly see that the RSI indicator crossed above the midpoint (50) indicating that the price of the asset is in a potential bullish trend movement. The price of the asset then breaks the resistance level ad the pull-back to rest the previously broken resistance level which is serving as support now. We can also see that the bullish movement of the price of the asset continued after the retest on the broken resistance level and shot higher.
A buy entry can be executed after observing two bullish candles formation on the new support level by placing take profit aiming at the previous high point of the price movement of the asset. Also, stop loss should be placed below the resistance level.
Breaking of Support zone:- Similarly, the Breakout of support takes place when the price of an asset crosses and closes below a swing low point identified on the chart which indicates either a continuation of the bearish trend or a start of a new trend. I would explain two ways in which breakouts of resistance can take place below here in this article. The first one we would look at is the break of support and continuation.
Break of Support and Continuation:- for this event or occurrence, the price momentum of the asset is observed to be high and volatile and as such immediately the price of the asset breaks the support level, the downtrend continues without any retest to the previously broken support level. We will observe that the previously broken support will now become the new resistance level of the price movement. I would demonstrate a good example here using the crypto chart as an example.
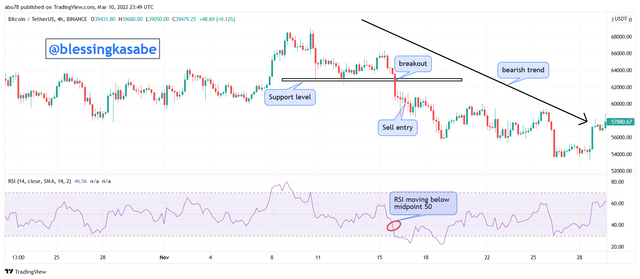
From the chart shown above, we can see that I used the RSI indicator to identify the support breakout. We can clearly see that the RSI indicator crossed below the midpoint (50) indicating that the price of the asset is in a potential bearish trend movement. The price of the asset then breaks the support level with high momentum and volume as we can see above from the screenshot taken. We can also see that the bearish movement of the price of the asset continued without any retest on the broken support level due to the high momentum of the price movement of the asset.
A sell entry can be executed after observing two bearish candles formation on the new resistance level by placing take profit aiming at the previous low point of the price movement of the asset. Also, stop loss should be placed below the support level.
Break and Retest of Support Zone:- another way support breakout occurs is the break and retest of the support zone. In this scenario, the price of the asset breaks the support level and then later pulls back and retests the broken support level (new resistance level for the downtrend). After the retest, the price of the asset then continues in the downtrend movement. A good illustration is indicated below here in this article.
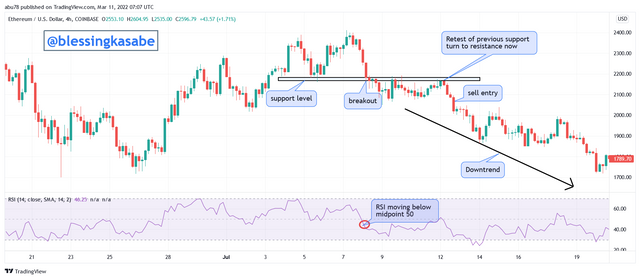
From the chart shown above, we can see that I used the RSI indicator to identify the support breakout. We can clearly see that the RSI indicator crossed below the midpoint (50) indicating that the price of the asset is in a potential bearish trend movement. The price of the asset then breaks the support level ad the pull-back to restest the previously broken support level which is serving as resistance now. We can also see that the bearish movement of the price of the asset continued after the retest on the broken support level and fell further.
A sell entry can be executed after observing two bearish candles formation on the new resistance level by placing take profit aiming at the previous low point of the price movement of the asset. Also, stop loss should be placed below the support level.
In this section, we would be looking at false breakouts and how to identify and avoid false breakouts during trading. We would first define false breakouts and then look at bullish and bearish false breakouts with crypto chart examples.
A false breakout is an event that occurs when the price movement of an asset below or above a support or resistance level fails due to liquidity in the market. It happens when the price of the asset deceives the possible breakout point of an asset. When false breakouts occur, it is an indication that a higher amount of force in the form of cash wash is introduced in the opposite way to counter the breakout and force the price of the asset to continue in the previous direction.
False breakout takes place as a result of a faster change of the sentiment in the market. Traders must be cautioned about false breakouts so as to prevent losses in trading. Many indicators especially volume-based indicators should be used to avoid false signals in the market. Let's now look at the bullish false breakouts.
Bullish false breakout:- this happens when the price of an asset crosses above the resistance level of the price movement and then fails to further up in the direction of the breakout. We tend to see the price of the asset close back below the resistance level which shows that the selling pressure is being encountered by higher forces at the resistance level or zone. A good illustration is shown below from the chart indicated.
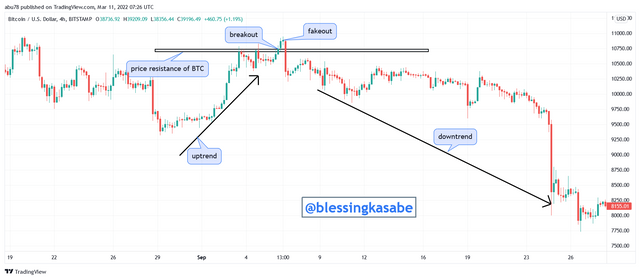
From the chart indicated above, we can see that the price of the asset moved towards the resistance level and then further broke the resistance level up. The price movement of the asset then closed below the resistance level which tells us that there was an encounter of the selling pressure at the resistance level which compelled the price of the asset to move downwards. Retail traders are mostly caught in this situation because they solely depend on breakout analysis in trading.
Bearish false breakout:- this happens when the price of an asset crosses below the support level of the price movement and then fails to fall down in the direction of the breakout. We tend to see the price of the asset close back above the support level which shows that the buying pressure is being encountered by higher forces at the resistance level or zone. A good illustration is shown below from the chart indicated.
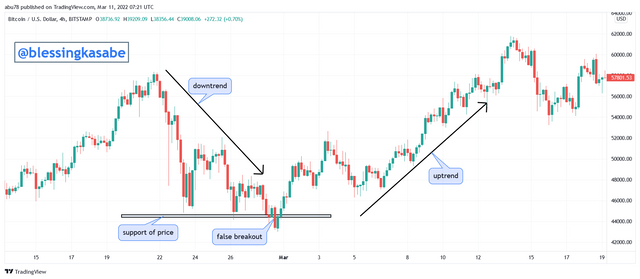
From the chart indicated above, we can see that the price of the asset moved towards the support level and then further broke the support level down. The price movement of the asset then closed above the support level which tells us that there was an encounter of the buying pressure at the support level which compelled the price of the asset to move upwards. Retail traders are mostly caught in this situation because they solely depend on breakout analysis in trading.
In this section, I would perform a demo trade on crypto asset when a resistance breakout occurs. Without much ado, let's go straight to the first trade.
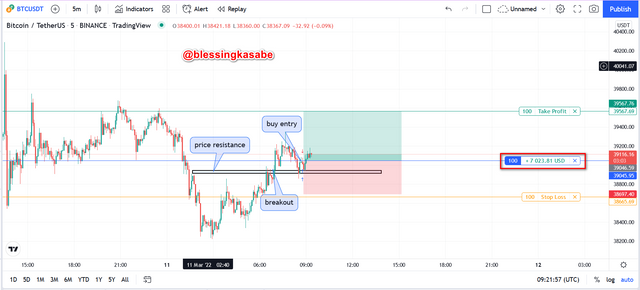
Buy entry trade for BTCUSDT (5 MINS)
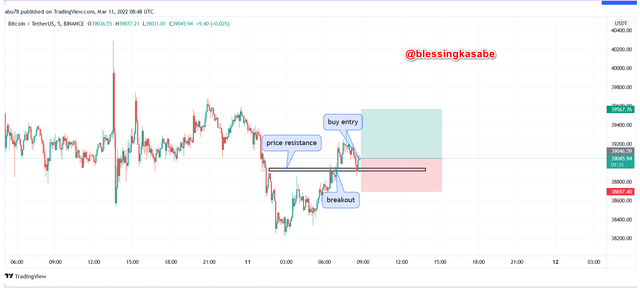
From the BTCUSDT chart shown above, we can clearly see that the price of BTC broke above the resistance level $38,912.56 and $38,942.45 and a further increase in price occurred as indicated. The price of BTC pulled-back and retested the resistance now turned to support. I then waited for two bullish candlesticks to form above the support level after which I immediately placed a buy entry trade.
I executed a buy order at $39,045.95 with target profit set at $39,567.76 and stop-loss set at $38,665.69. I set my risk to reward ratio at 1:2 so as to avoid much loss.
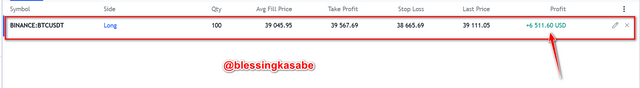
After leaving the trade for about 15 to 20 minutes, I made profit over $7K. This is really a good strategy in trading if rightly used or implemented.
Sell order trade for DOTUSDT (3 MINS)
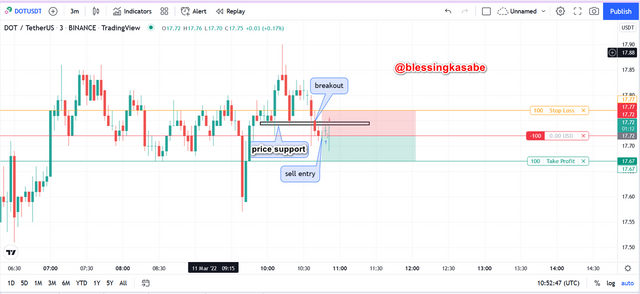
Sell entry trade for DOTUSDT (3 MINS)TradingView.com
From the DOTUSDT chart shown above, we can clearly see that the price of DOT broke below the support level $17.74 and $17.75 and a further decrease in price occurred as indicated. The price of BTC continued to move downwards and I then waited for two bearish candlesticks to form below the support level now turned resistance after which I immediately placed a sell entry trade.
I executed a sell order at $17.72 with target profit set at $17.67 and stop-loss set at $17.77. I set my risk to reward ratio at 1:1 so as to avoid huge loss.
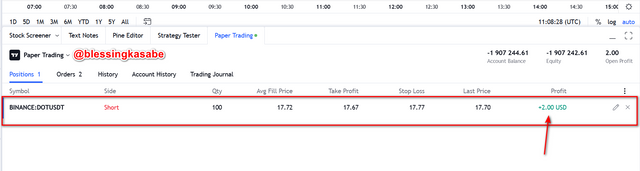
After leaving the trade for about 15 to 20 minutes, I made profit over $2. This is really a good strategy in trading if rightly used or implemented.
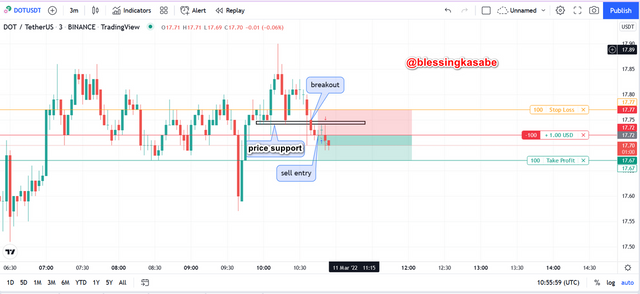
Sell entry trade for DOTUSDT (3 MINS) after sometime TradingView.com
Conclusion
To conclude with, I would like to summarize what have been done sop far in this article. To start with, first of all, we looked at the concept of support and resistance level and also the advantages or benefits of identifying support and resistance levels before trading. Again, we looked at the concept of breaking or supports nad resistance levels by illustrating an example on crypto chart with the aid of the RSI indicator.
Furthermore, we discussed the concept of break of support by illustration an example on crypto chart with the aid of the RSI indicator too. We discussed the two possible ways of breaking of support and resistance levels.
Moreover, we looked a the the concept of false breakouts in the price movement of an asset. We showed examples of false breakout using crypto charts on trading view platform.
We also performed a buy demo trade when resistance breakout takes place and a huge amount of profit was obtained after executing trade indication that my entry point was perfect and accurate. Finally, we also performed a sell order trade (demo) when support breakout occurred and similarly, we earned profit after some time when the trade was executed.
I would like to say a very big thank you to professor @pelon53 for this wonderful lecture. I have really understood the concept of "Support and Resistance Breakouts".
Thank You.