Steemit Crypto Academy Season 2 Week 4 Homework post for @kouba01.: Cryptocurrency Trading With RSI.

Dear Steemians,
I am glad to be part of this week's lesson. Thanks to Professor @kouba01 for giving us this excellent lecture on how we can trade Cryptocurrency Tusing RSI.
After going through the notes and researching this week's topic, I have decided to review what I have learned in my homework task.

What is the Relative Strength Index - RSI and How is it Calculated?
RSI can be understood better if we know what a Relative index is. A relative index is a trading strategy which traders use as an oscillating indicator like the Moving Average Convergence Divergence (MACD). Willis Wilder developed the relative Index as a technical tool to help investors decide the right time to enter or exit the market.
A relative strength index is a tool used to determine an asset's market to help traders know which way to handle the asset. In the crypto market, the relative strength index has a default mean value of 50; RSI ranges from 0 to 100. In the crypto market, if the relative strength index goes above 50, the asset is said to be at a bullish state, and if it goes below 50, it is said to be at a bearish state.
An asset is seen as been overbought if its RSI is above 70, and it is also seen as oversold if its RSI is below 30.

In RSI, the term "Average" is used for calculating the sum of the individual entries divided by the total number of entries.
For a better understanding of Average, let say iI sat for an exam and had the following marks 70, 80, 60, 75. To calculate the Average of my exam score.
I will sum all the marks and divide the result by the number of marks to obtain the average score,
Total marks 70+80+60+75=285
the Average will be 285/4= 71.25
Applying this term in the digital market, considering a digital coin such as BTC cash having continuous rising five days within a week and has an average profit of 3.5% and suddenly starts declining for the remaining days of the week, which leads to an average loss of 1.6%
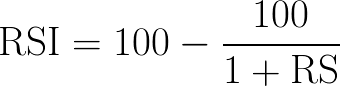
To calculate the RSI of this asset. we substitute the data in the RSI formula,
RSI= 100 - [100/1+3.5/1.6]
RSI= 100 - 31.37
RSI= 68.63
With an average gain of 3.5% and an average loss of 1.6%, we have been able to calculate our RSI to be 68.63
From the data above. the RSI for BTC cash 68.63, which is above the median mark.
In the market, we will say BTC cash attain a bullish state. However, if it was to be below 50, it will have in a bearish state.
Can We Trust The RSI On Cryptocurrency Trading And Why?
Like any crypto tool, RSI also has its setbacks that a trader can not entirely depend on. Despite its usefulness in the crypto market, it does not always give a correct result due to other factors influencing the stock markets and other essential aspects of the market.
Sometimes RSI continues to in an overbought or oversold state, making it difficult for traders to predict the direction of a particular asset. RSI will be more valuable if supported by resistance, support, and other crypto factors.
How Do You Configure The RSI Indicator On The Chart And What Does The Length Parameter Mean? Why Is It Equal To 14 By Default? Can We change it? (Screen capture required)
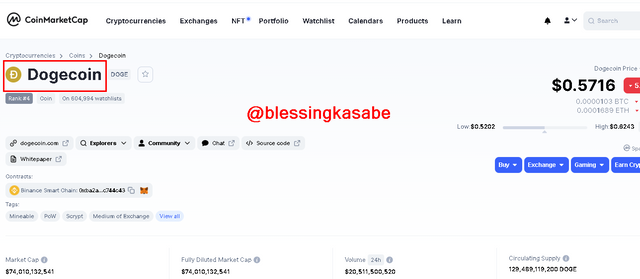
- To configure the rsi indicator on the chart, for the sake of this illustration, I will be using https://coinmarketcap.com/
- Login to coinmarketcap and select the cryptocurrency of your choice
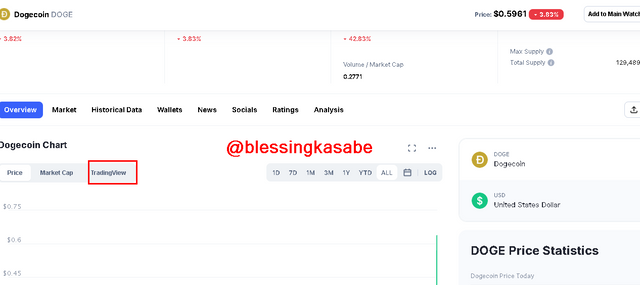
- Locate the "TraidigView" tab
- Click on the "Fx indicator."
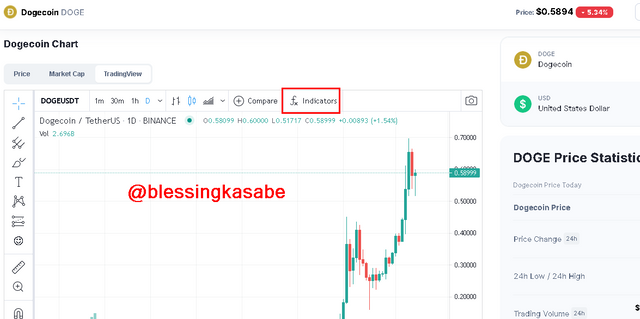
--
- Writ in the search box "Relative Strenght Index" and search
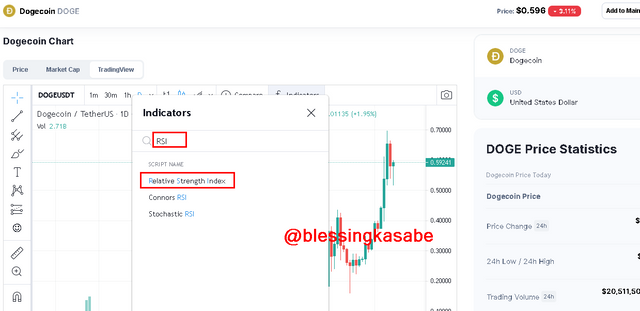
- Look for the configuration button
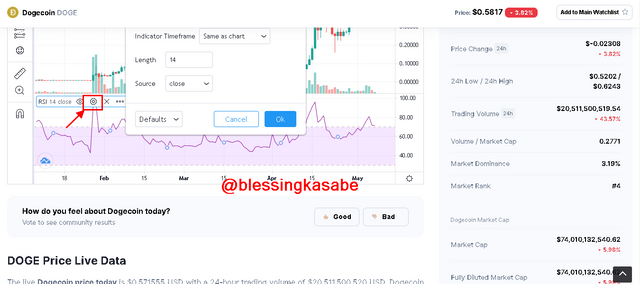
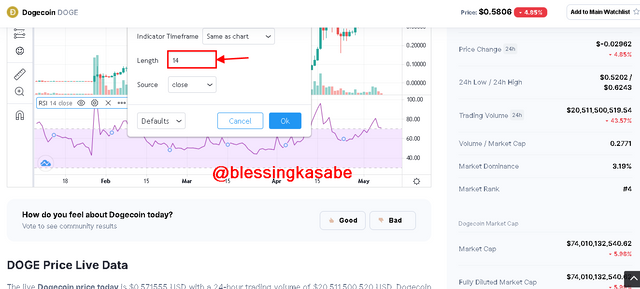
- When clicked on the configuration button, the default RSI length value is 14; it establishes the periods between the various changes in the market price of an asset and some other important values such as time, etc.
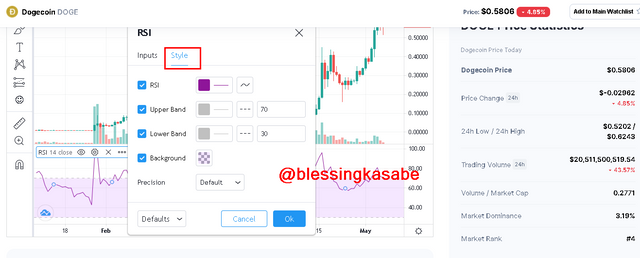
- The style of the chart can also be modified
** Why is it equal to 14 by default?**
RSI is set at 14 as default to be equivalent to 14 days, months, or years. At 14, traders can appreciate the different trends of the asset. Lower values of RSI give undesirable signals in the market trends of an asset.
Can we change it?
The value can be changed based on what the trader is looking for; trends or high or low peaks for quick buying and selling can influence the value change of the RSI.
How do you interpret the overbought and oversold signals when trading cryptocurrencies? (Screen capture required)
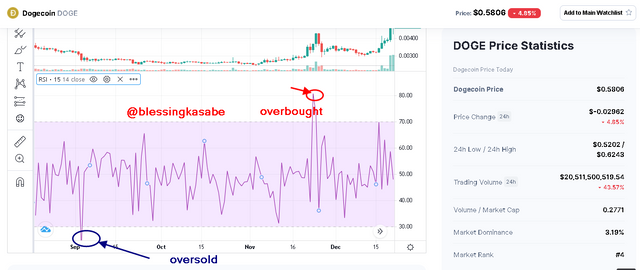
The above graphs show how to interpret the overbought and oversold signals when trading in cryptocurrencies. The overbought signal is shown with a red color which is the relative strength index value above 70.
The oversold is also shown with a blue color indicating the relative strength index value below 30.
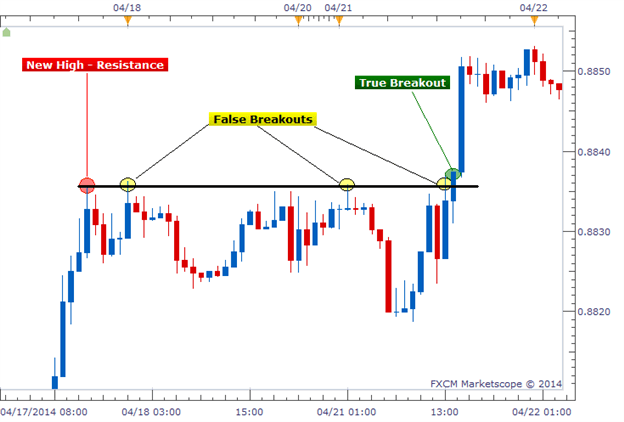
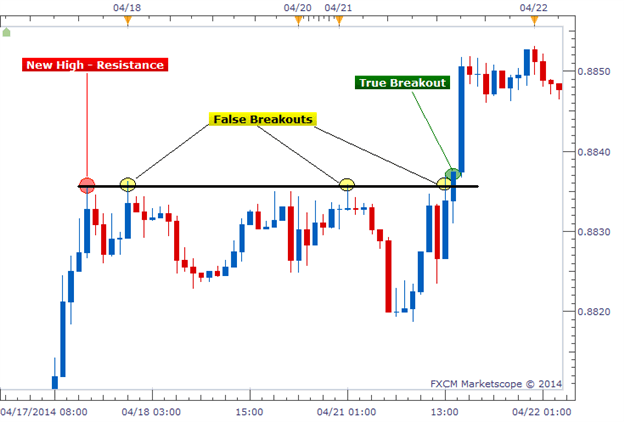
How Do We Filter RSI Signals To Distinguish And Recognize True Signals From False Signals. (Screen capture required)
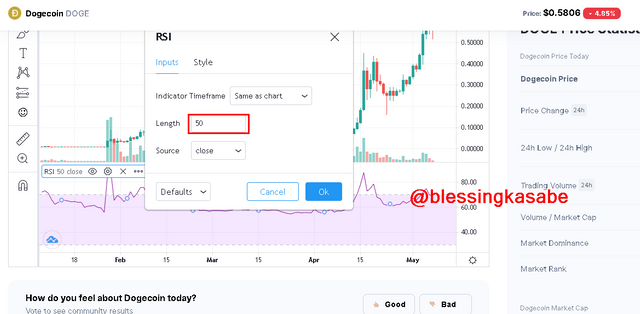
A Low RSI period typically gives a false signal, resulting in the significant price change of an asset on either side. The best way to increase the accuracy of the RSI filter is to set the RSI period from the default 14 to 200.
Setting the RSI period at 200 will check for the last 200 candles of the asset and measure both average profit and loss. With the past 200 candles of the asset, if the average profit is more than the average loss over the past 200, the indicator will be above 50. Likewise, if the average loss is more than the average profit, then the indicator will be below 50.
Review the chart of any pair (e.g., TRX / USD) and present the various signals from the RSI.
The chart below shows the various RSI signals of BTC/USDT.
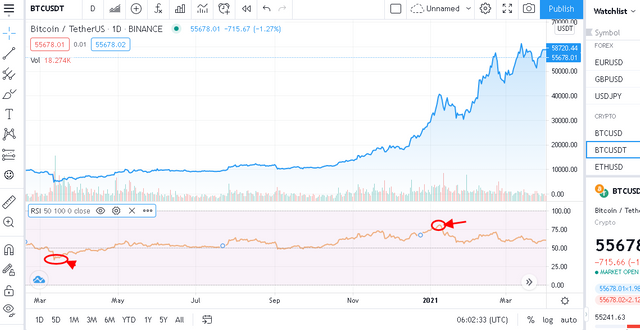
With the above chart, the RSI signal was above 50 in the first quarter of 2021. This is the best time for investors to exit the market. The chart also shows an RSI signal below 50 around march 2020; that period is the best time for traders to enter the market.
The RSI indicator shows the asset price above 70; this shows the asset has been overbought. With this indication, the traders will try to sell their assets, pushing the price top equilibrium. Likewise, when the price is below the 30 marks, it simply means that the asset has been oversold. With this, traders can capitalize on that and enter the market.
Conclusion
I thank professor @kouba01 for the lecture on the relative strength index. In the lecture, he taught the importance of the RSI to the trader.
RSI is an indicator that helps investors to detect overbought and oversold signals making it easy for investors to decide the right time to invest. RSI will be more valuable if supported by factors such as resistance, support, and other crypto factors.
Thank you for reviewing my work
Hello @blessingkasabe,
Thank you for participating in the 4th Week Crypto Course in its second season and for your efforts to complete the suggested tasks, you deserve a 5/10 rating, according to the following scale:
My review :
Medium content, it lacks accuracy in answering some questions and analyzing some important points due to not being well understood. Try to take your time researching the basics of the RSI and their uses.
Thanks again for your effort, and we look forward to reading your next work.
Sincerely,@kouba01
Thank you for reviewing my work