[Crypto Trading Using Zig Zag Indicator]- Crypto Academy /S6W1-Homework Post for professor @kouba01
.png)

Introduction
The Zig-Zag indicator is one of the trend-based technical indicators that display the current assets price trend through the use of peak highs and lows (relevant peak swing point) which is connected through diagonal lines representing the zig-zag trend.
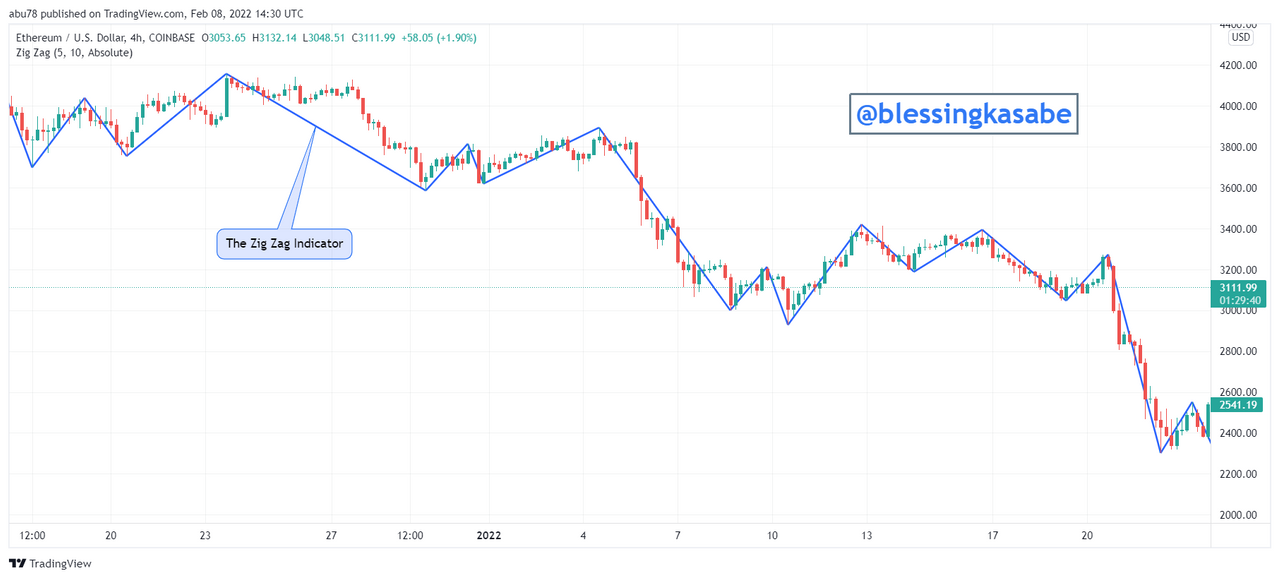
The ZIg-zag indicator is used to identify and spot out the highest and lowest price points of an asset on a chart after which a line is drawn to join the price points identified. The zig-zag indicator is used in joining different price points of an asset on a chart. When the price of the asset or when the market goes higher or lower than a determined percentage depth selected by the trader, then a new zig-zag indicator line would be plotted to join the points together.
When this happens, either a new swing high or swing low would be created which is an indication of a trend move, thereby aiding traders to spot the smallest(macro) trend very easily and faster. In order to ignore the micro trend movement in the market, the calculation of the zig-zag indicator is implemented which results in ignoring the random fluctuation of the price of the asset. The random fluctuation of the price of the asset is ignored because the movement of the micro trend is within the indicator's setting of the determined depth of the asset's price movement.
The zig-zag indicator is used as a way of gathering information when about to involve in trade, unlike in the case of other trend-based indicators where they help in predicting trend reversals and also produce trade signals as well. The zig-zag indicator helps to base the random price fluctuation's impact or effect in the crypto market and also helps traders to spot price trends and changes in the price trends of assets on charts.
The zig-zag indicator again helps traders to spot potential support and resistance zones that exist between the plotted swing highs and swing lows although it does not predict the future trends of assets. It also reduces noise levels in the market and it works best in strongly trending markets in the crypto world. To understand the formation of the zig-zag indicator line, it is formed whenever prices of an asset are reversed by a certain percentage that is greater or higher than a pre-selected variable. When this happens, straight lines are then drawn to connect these points.
How the Zig-Zag indicator is calculated
To do this I would first quote the formula for the Zig Zag Indicator below here in this article;
Zig-Zag (HL, %change = X, retrace = FALSE, LastExtreme)
If % Change >= X, plot Zig-Zag
where;
HL = the High-Low price series or closing price series
%change = the Minimum price movement in percentage
Retrace = Is the change of a retracement of the previous move or an absolute change from peak to trough?
LastExtreme = If the extreme price is the same over multiple periods, is the extreme price the first or last observation?
Now, after we have gotten the formula above we would then look at the steps to be taken on how to calculate the zig zag indicator. These steps are summarized below here;
First of all, select a starting point i.e. a swing high or a swing low
Select the % price movement
Identify and spot the next swing high or swing low that is different from the starting point = > % price movement
You then draw a trendline from the starting point to the new point identified.
Again, you identify and spot the next swing high or swing low that is also different from the new point = > % price movement
We then draw the trendline again to join the new swing high or low identified.
We then repeat to the most recent swing high or swing low in the price of the asset.
The zig-zag indicator possesses two main parameters are Deviation and Depth parameters. These two parameters must work together effectively to help in the functioning of the zig-zag indicator. I would briefly touch on each of the two-parameter by starting with the Deviation parameter.
Deviation Parameter refers to the determined minimum percentage of price movement of an asset that has to be formed from the previous swing point to the new swing point before the new swing point can be validated as a zig-zag swing point by the zig-zag indicator. The Deviation parameter has a default setting of 5 and this means that the total percentage change in the price of the asset should move by at least 5% from the previously spotted or identified swing point. Now let's look at the Depth parameter.
Depth Parameter on the other hand, refers to the determined minimum number of periods in which a new seeing high or swing low would not be plotted from the previous swing point by the indicator based on the percentage movement used in the trade. The Depth parameter also has a default setting of 10.
How to configure Zig-zag Indicator Parameters
In this section, I would be using the tradingview. com platform to perform the configuration of these two parameters. To do this, let's follow the steps shown below;
- First of all, visit the TradingView from the link provided here.

- Click on the Indicators option from the menu bar above the Chart as shown below.

- Once you click on the Indicator option, a search tab appears when you type in the "zig-zag" indicator and when it appears you then click on it to add the indicator to the chart.

- We can now see that our indicator has been added successfully.

- Now, to configure the parameters mentioned above, we would click on the settings icon on the zig-zag Indicator.

We can now see the two parameters shown above, if you want to change or configure any of them then you can do so here, but for the purpose of this work, I would leave them at the default settings as indicated above. We have the default setting for Deviation % at 5 and the Depth default setting also at 10 as I said earlier.
Sometimes many traders do vary the depth parameter and when it is wrongly done, it generates high sensitive or intensive readings of the crypto chart. Generally, it is advisable to alter these settings with respect to timeframe, the trading system used, and also the type of asset to use this indicator on.
Determining Trends using the Zig Zag Indicator
The Zig Zag indicator as we said earlier is used purposely for identifying the current trends of crypto assets in the market. In the identification of trends using the zig-zag indicator a diagonal line joining successive highs and lows of the price of an asset on the chart is what aids in identifying trends. This diagonal line is automatically generated from the general formula we stated above in this article.
In identifying an uptrend, the zig-zag indicator moves up with the up-trending price of the asset. In this trend, we see that the new high is higher than the previous high as well as the low being higher than the previous low. When this occurs then it is a confirmation of an uptrend structure in the market of the asset's price.
A good example is shown below in the chart.

From the chart shown above, we can obviously see that the new swing high is higher than the previous high with respect to the depth movement of the price of the asset in the market.
Similarly, in identifying a downtrend, the zig-zag indicator moves down with the down-trending price of the asset. In this trend, we see that the new low is lower than the previous low as well as the high being lower than the previous low. When this occurs then it is a confirmation of a downtrend structure in the market of the asset's price. A good example is shown below in the chart.

From the chart shown above, we can obviously see that the new swing low is lower than the previous low with respect to the depth movement of the price of the asset in the market.
Determining Buy/Sell Point using the Zig Zag Indicator
To determine either buy or sell trade using the zig-zag indicator, we must take into consideration the current price trend of the asset in the market. When the asset's price trend is in an uptrend then we can execute a buy order, likewise, if the trend of the asset is in a downtrend then we execute a sell order.
Buy Order
To execute a buy order using the zig-zag indicator, the buy entry trade should be placed immediately after the formation of the next low higher than the previous low in an uptrend market of the asset's price. In here we place the stop-loss below the new low formed or the support. A good illustration is shown in the chart below.

From the above chart, the buy order was placed just after the formation of the low higher than the previous low and stop-loss placed just below the newly higher low formed.
Sell Order
To execute a sell order using the zig-zag indicator, the sell entry trade should be placed immediately after the formation of the next high lower than the previous high in a downtrend market of the asset's price. In here we place the stop-loss above the new high formed or the resistance. A good illustration is shown in the chart below.

From the above chart, the sell order was placed just after the formation of the high lower than the previous high, and stop-loss was placed just above the new lower high formed.
In this section, we would look at how to use the zig-zag indicator to identify or spot out support and resistance levels on crypto charts. The support and resistance levels are very important points or swing points in the price of an asset that depicts buyers' and sellers' reactions to the price of an asset in the crypto market. Support and resistance levels display some past information about the reaction at that point. A strong support and resistance level is indicated by the number of times the price of an asset previously reacted around those points.
The zig-zag indicator helps to determine a series of retests that are taken as validated support and resistance levels.
Identifying Support level using the Zig-Zag Indicator
In identifying the support level using the zig-zag indicator, a multiple or series of a horizontal low level is plotted with a re-bounce from that level. When this occurs, it is an indication that the price of the asset at that support level is strong enough to deny continuous downward movement of the price of the asset. A clear illustration is shown below from the chart.

From the above chart, we can clearly see that the support levels have been identified by the zig-zag indicator via a multiple of retests at that level, and then a rejection of the price of the asset at the support level was followed after.
Identifying Resistance level using the Zig-Zag Indicator
In identifying the resistance level using the zig-zag indicator, a multiple or series of a horizontal high level is plotted with a re-bounce from that level. When this occurs, it is an indication that the price of the asset at that resistance level is strong enough to deny continuous upward movement of the price of the asset. A clear illustration is shown below from the chart.

From the above chart, we can clearly see that the resistance levels have been identified by the zig-zag indicator via a multiple of retests at that level, and then a rejection of the price of the asset at the resistance level was followed.
In this section, I would be combining Commodity Channel Index (CCI) indicator with the zig-zag indicator to determine different points on a crypto chart. Although the zig-zag indicator can be used with other indicators to produce good signals, for the purpose of this lesson, I would combine that with the CCI indicator.
The trading system here is going to be an intraday as suggested by professor @koluba01 and this would be done using the CCI indicator with the zig-zag indicator. The Commodity Channel Index (CCI) indicator is one of the oscillation-based indicators that depict the condition of the market of an asset with respect to overbought and oversold. It has bound ranges that help to determine overbought and oversold in the price of the asset. When the CCI reads above 100 bound range then this is considered to be overbought and similarly when the CCI reads below 100 bound range then it's considered to be oversold in the market.
Here we should know that by combining the zig-zag indicator with that of the CCI indicator, we shall make use of a breakout strategy to determine trends. This breakout strategy indicates that a break and close in the price of the asset above the previous high or low is in a relationship whereby the CCI is also seen to be above or below the 100/-100 mark on the CCI indicator. Now let's look at situations whereby we can determine buy and sell opportunities using the zig-zag and CCI indicators together.
Buying Opportunity using Zig-Zag with CCI indicator.
This situation occurs in an uptrend whereby a buy entry trade would be considered if and only if a candle closes above the previous high of the asset's price and simultaneously the CCI indicator is seen to be above the 100 mark. A good illustration is indicated in the chart below.
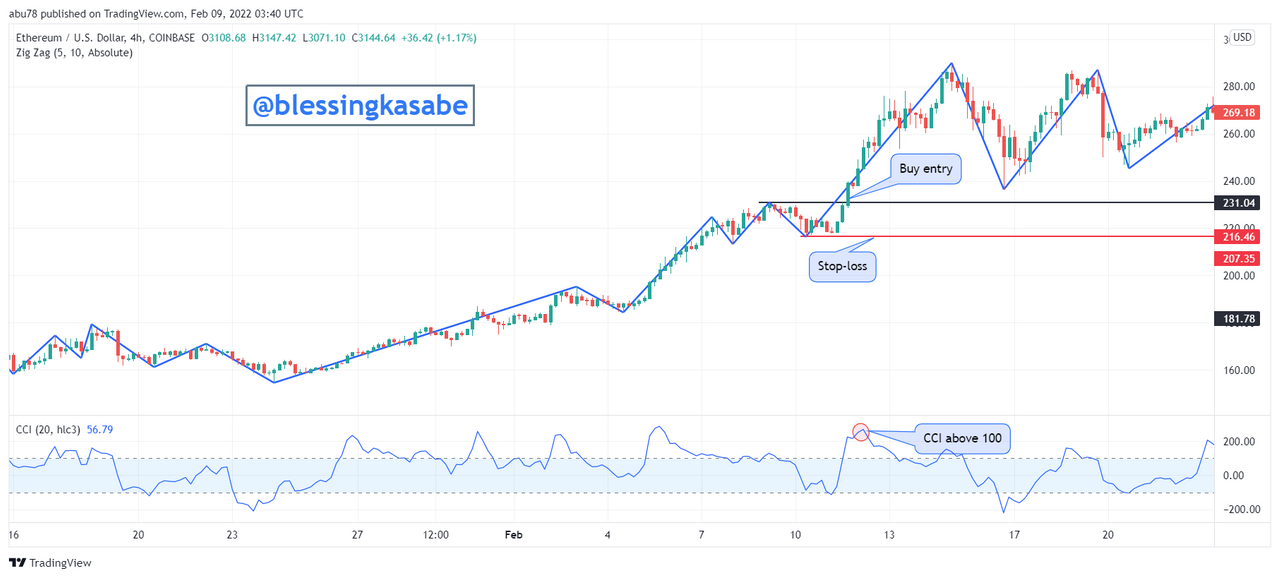
From the chart shown above, we can see clearly that the price of the asset closed above the previous high, and at the same time, the CCI indicator is also seen to be above the 100 mark. When this occurs a buy signal is indicated and we execute a buy order whereby take-profit is placed closer to the nearest swing point whilst the stop-loss is set below the previous low or is placed in-between the previous zig-zag diagonal on a condition whereby the distance between the breakout and the low is seen to be wide.
Selling Opportunity using Zig-Zag with CCI indicator.
This situation occurs in a downtrend whereby a sell entry trade would be considered if and only if a candle closes below the previous low of the asset's price and simultaneously the CCI indicator is seen to be below the -100 mark. A good illustration is indicated in the chart below.

From the chart shown above, we can see clearly that the price of the asset closed below the previous low, and at the same time, the CCI indicator is also seen to be below the -100 mark. When this occurs a sell signal is indicated and we execute a sell order whereby take-profit is placed closer to the nearest swing point whilst the stop-loss is set above the previous low or is placed in-between the previous zig-zag diagonal on a condition whereby the distance between the breakout and the high is seen to be wide.
In this section, I would be using three different indicators with the zig-zag indicator to prove the need of pairing this indicator with others so as to avoid false signals when trading. Generally, there is no technical indicator that can function 100% effectively without the aid of other indicators as such the zig-zag indicator isn't left out. The three indicators that I would be pairing the zig-zag indicator with include the following; Fibonacci indicator, Moving Average Crossing, and the Relative Strength Index. Now we are going to take each separately and develop more on them.
1. Using the Zig-Zag indicator with the Fibonacci indicator
The Fibonacci retracement tool is used by traders to identify the possible end of a pullback and continuation of a macro trend in the price of an asset. This tool helps in determining the areas at which reaction occurs in the price of the asset by making use of the Fibonacci number sequence golden ratio (38.2%, ....).
When using the Zig-Zag indicator with the Fibonacci indicator, the Fibonacci retracement tool is marked such that it suits the trend determined by the zig-zag indicator. At the same time, the Fibonacci retracement level has to correlate with the marked points indicated by the zig-zag indicator. To open a trade, it is executed at the high or low end of the retracement which correlates with Fibonacci level or mark. An illustration is shown below in the chart.

From the chart indicated above, we can clearly see that the current trend of the price of the asset is bullish from the indication of the zig-zag indicator. We again see that the swing high formed correlates with the 50% Fibonacci retracement level perfectly as shown above and this indicates that there is a possible continuous up movement of the price. We then place a buy order right after the formation of a candle that is higher than the previous high. The stop-loss is placed below the previous higher low point whilst take-profit is set at the nearest higher high point.
2. Using the Zig-Zag indicator with the Moving Average Crossing indicator (20 and 50 EMA).
This is a trading strategy that involves two Moving Averages with one having a higher length/period setting than the other. From my example, the EMA 20 is indicated by the green line whilst the EMA 50 is indicated by the red line. In this strategy, when the EMA 20 crosses above the EMA 50 line then it is an indication of an uptrend. Similarly, when the EMA 50 crosses above the EMA 20 line then this is also an indication of a downtrend.
When using the zig-zag indicator with the moving average crossing trading strategy, we wait for a candle close in the price above the previous high or low after which we then cross-check to see if the two EMAs cross each other. An illustration is shown below in the chart.
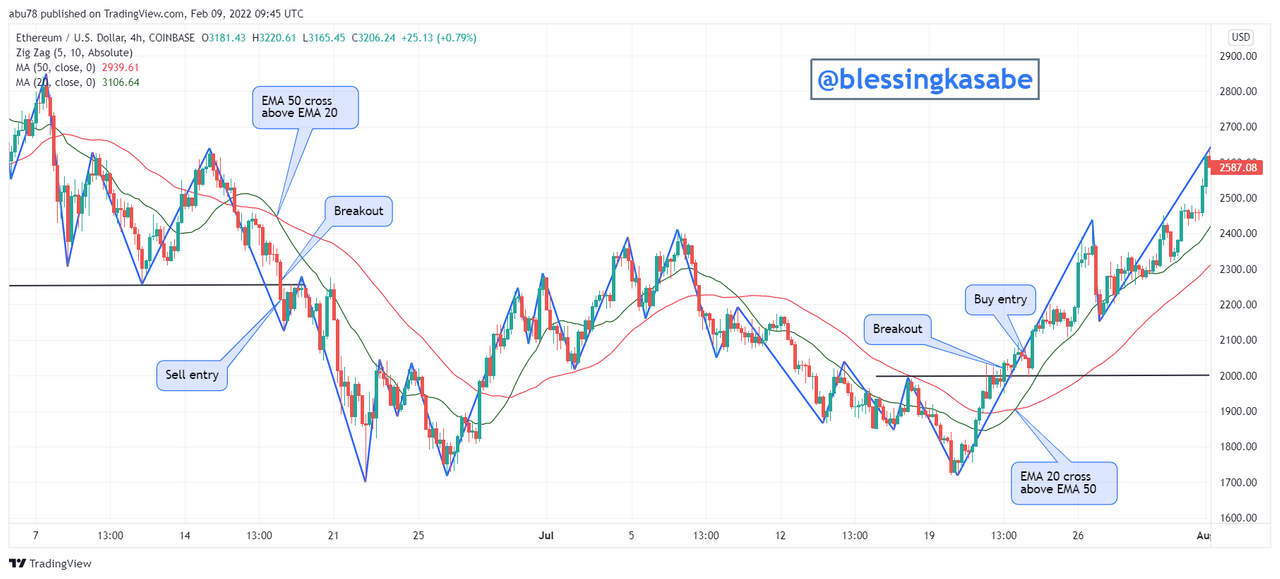
From the chart shown above, we can clearly see that before the formation of the breakouts in both trades, the Moving Averages signaled a breakout and that was what actually happen as we can see from the above chart.
3. Using the Zig-Zag indicator with the Relative Strenght Index indicator
This indicator identifies areas whereby there is overbought and oversold in the market of an asset's price. It's made of two levels i.e. 30 and 70 which helps in determining the condition of a market. When the price of an asset crosses above the RSI 70 level, then it is an indication of an overbought condition and an indication of a possible bearish trend as well. Likewise, when the price of the asset crosses above the RSI 30 level, then it is an indication of an oversold condition and an indication of a possible bullish trend in the market.
When the zig-zag indicator is used with the RSI indicator, we use a breakout strategy. This means that when a break and close in the price of the asset above the previous high or low is correlating with the RSI level at either above 70 or below 30. An illustration is shown below in the chart.

From the chart shown above, we can clearly see that the price of the asset closed below the previous low with the RSI indicator also below the 30 mark, thus indicating a sell signal for which a sell order was executed as shown above. In the other scenario, we can see that in this case, the price of the asset closed above the previous high and the RSI is also seen above the 70 mark indicating a buy signal. I then executed a buy order and placed take-profit to the nearest swing point whilst stop-loss is placed below the previous low point.
Advantages of the Zig-Zag indicator
The following includes some of the advantages of the zig-zag indicator;
The zig-zag indicator is compatible with all timeframes
The zig-zag indicator when used with other indicators produces accurate and good results
It helps to ignore the noise in the market due to fluctuations in the price of an asset.
The zig-zag indicator also helps traders to identify macro trends on crypto charts.
The zig-zag indicator is simple and easy to read thereby making it possible for novice traders to use it.
Disadvantages of the Zig-Zag Indicator
With the benefits of the zig-zag indicator mentioned above, there are also limitations and they include the following;
The zig-zag indicator does not provide additional information about trends but only traders to identify the current trend.
The Zig-Zag indicator redraws the last stretch on the price that involves the current price and as such cannot predict the next movement of the price of an asset on its own without the support of another indicator.
Conclusion
To conclude, I would like to brief you on what has been done in this article. First of all, we discussed the concept of the Zig-Zag indicator and how its calculation is done. We further went on to look at the two main parameters of the Zig-Zag indicator and also looked at how they are configured.
Furthermore, we discussed how one can use the zig-zag indicator to predict bullish and bearish trends in the market by using crypto charts as examples. We again looked at how to use the zig-zag indicator to identify support and resistance levels on crypto charts.
Moreover, we discussed how to use the CCI indicator with the Zig-Zag indicator to determine the different points in an Intraday trading strategy. We discussed this we obvious examples as shown above in question 5. We again looked at the concept of pairing the zig-zag indicator with three different types of indicators to identify trends and also fish out false signals. These three other indicators were Fibonacci, RSI, and MA.
Finally, we discussed the advantages and disadvantages of using the Zig-Zag indicator. I would like to say a very big thank you to professor @kouba01 for this wonderful lecture. I have really understood the concept of "Crypto Trading Using Zig-Zag Indicator".
Thank You.