[Basics to trade cryptocurrencies correctly, Part 1] - Crypto Academy / S6W1 - Homework post for professor @nane15

Introduction
Trading as implied in the section of finance can be defined as the method of exchanging assets, cryptos, commodities, etc with the aim of earning profits. This means that trading can simply be referred to as the process of buying and selling crypto assets, commodities, assets, etc in order to make profits.
In order to achieve this aim, i.e to make profits on assets bought or sold, a trader must be able to apply and utilize the principles of supply and demand in order to take good advantage of the difference in the price of the asset within a specific given time to decide whether the price of the asset has inflated or deflated.
Trading is just the matter of buying an asset at a discount price and later selling it at a higher price so as to make or earn profits. This indicates that effective trading has to be the one that would bring profit to your wallet and not any losses. This shows that effective trading must be followed with a significant increase in the price of the asset as compared to the previous price or the price you bought the asset.
When we look and analyze the trend and price movement of crypto assets in the crypto world, we can see that there is a high fluctuation in the price of the asset which is a result of the reaction forces from buyers and sellers in the market. These reaction forces executed by buyers and sellers are done through liquidity level, and demand and supply of the asset.
When we go back and examine the principles of supply and demand, we get to realize that buyers and sellers are both influential people in the final price movement of the asset. This indicates that when buyers enter into trade and start buying the assets, it creates a force (demand) that pushes the price of the asset high, and similarly, when sellers also take over the market and start selling the asset, it creates a (force) that pushes the price of the asset down.
The types of Trading Analysis
I would like to enumerate some methods of trading analysis used by most traders in the crypto market. This analysis helps traders to trade effectively to earn profits and avoid losses. I would briefly explain the following three types of trading analysis methods on which every trader should have the knowledge and also understand how its tools elements work in predicting the future price trend of an asset. They are; fundamental analysis, sentimental analysis, and technical analysis.
First of all, we would look at the fundamental analysis and its function. The fundamental analysis refers to a type of analysis that employs the use of socio-economic events such as interest rates, inflation, political events, etc in predicting the future price of an asset in the market. Fundamental analysis helps traders in predicting the price behavior of an asset in the crypto market. Fundamental analysis again directs traders on when to enter and exit trades in the market. In fundamental analysis, external news is used by traders to be vigilant concerning any price fluctuations in the price of the asset. The financial events in the fundamental analysis are the major cause that influences the supply and demands forces which results in a change in the price of the asset.
Secondly, we look at the sentimental analysis and its function. Sentimental analysis is also a type of trading analysis that involves the trader's or individual's suggestion and opinion about the trend of the market. The sentimental analysis does not involve the use of any tools in predicting the future price of assets but instead depends on the ideas and opinions of traders/investors. It is harnessed by human factors like fear, emotions, greed, etc, and as such enables traders to bring out decisions that are very logical. Sentimental analysis is less accurate as compared to other trading analyses.
Lastly, we would look at the technical analysis method. This method of trading analysis uses tools such as patterns, candlesticks, indicators, charts/graphs, algorithms, etc in predicting the future price of the asset by analyzing the historical data of the asset's price. The technical analysis is good and compatible with all timeframes of crypto charts. Furthermore, technical analysis helps traders to depict low-risk and good entry and exit points in the market. Technical analysis is currently the most widely used trading analysis by most traders.
In this section, I would be discussing the strong hand and weak hands trends in the market. I would begin with Strong hands.
Strong Hands
Strong hands in the market refer to the huge investment of capital by investors and market brokers used in trading in the finance sector. The investors involved in this trading include the following; private equity firms, investors from institutions, hedge funds, etc. These investors affect a high impact on the price of an asset due to the huge sum of money used in the trading activities. When it comes to the crypto world, these investors are termed as whales just like steemit whereby we call those with huge Steem Power whales and they can impact change to the price of steem currency at any moment.
Accumulation and distribution of trade orders by the investors of strong hands in the market lead to the formation of trends/patterns and this is a result of the huge sum of money used in executing trade orders in a specified price movement of the asset. When this happens, it leads to the formation of high demand and supply of the asset that is traded, and this results in either an increase or a decrease in the price of the traded asset.
Looking at what happens in the distribution phase and accumulation phase, I would first talk about the distribution. In the distribution phase, that is when the strong hand investors remove their monies from the market as profits when the price of the asset reaches its peak level or at its high price. The investors then sell their assets during this period and as such leads to the creation of a high supply of the asset which then forces the price of the asset to decrease or fall.
Conversely, in the accumulation phase, that is when the strong hand investors put in a huge sum of monies to buy the asset in a large quantity especially when the price of the asset is low. When this happens, the demand for the asset is high which tends to force the price of the asset to increase or rise in an upward direction.
A good illustration is shown below here in this article;
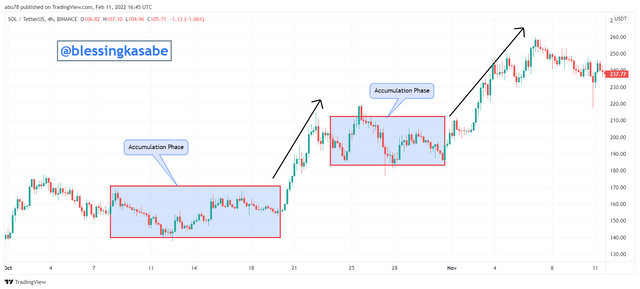
From the SOLUSDT Chart shown above, we can clearly see that two accumulation phases occurred here which led to the increase in the price of SOLANO in the market. The first accumulation was as a result of strong hand investors putting a huge sum of monies to buy SOLUSDT which led to the increase in the price. Again, a further accumulating phase was observed when more strong hand investors entered the market to purchase more of the asset and as a result, a further rise in the price of SOLUSDT was observed as shown above in the screenshot.
Similarly, from the same SOLUSDT Chart shown above, we can see that three different distribution phases were encountered. The first distribution phase occurred as a result of strong hand investors leaving the market and selling the assets at the high price of the asset which tends to decline the price of SOL. A second distribution phase was encountered again when more strong hand investors were leaving the market which also led to a further decrease in the price of SOL. Again, the third distribution phase was formed when most strong hand investors pulled out their monies from the market and a furthermore decrease in the price of SOL was observed as shown above.
Weak Hands
The weak hand is just the opposite of that of strong hands in the market. What I mean here is that weak hands in the market refer to the small investment of capital by investors and market brokers used in trading in the finance sector. The investors involved in this trading include the following; private individuals, investors from organizations, retail funds, etc. These investors here unlike the strong hand investors impact little to no effect on the price of an asset due to the small amount of money used in the trading activities. Weak hand investors do not have many resources in trading assets in the market. They also lack confidence in their trading activities and as such do not hold trade positions for long. Weak hand investors end up losing monies in the market because they buy at a high price level and sell the assets at a low price level.
In choosing between the two, I would go for thinking like a pro, and the following are my reasons. Pro strong hand investors in the market have the chance and capability of changing the price of the asset in the preferred direction which grants them the opportunity to manipulate and affect change in the price of the asset at any time they want. A good approach to training assets in the market is by avoiding false signals which come from external news that influence the asset's price temporarily and also by following the principles of strong hand investors and trade when you see a clear and obvious trend of the asset.
A pro thinker and trader masters skills and techniques that help him/her in trading without much concern to certain emotions trade which can leave a trader confused in the market. A trader must think like a pro because for strong hand investors trades, they are based on obvious logical facts which can be spotted on crypto charts.
Looking at the strong hand investors trading system whereby it follows the demand and supply principles as explained above in the previous question, we can say that the huge sum of monies in which they enter into trades with to purchase assets at a discount price and then later sell them at a higher price is a matter of earning profit and that is a pro thinker method. Similarly, a weak hand investor also thinks like a pro when he applies a similar principle of trading in the market to earn profit.
Trend Trading
Trend as we all know is very important to all traders and investors in the market because it is what traders and investors use in determining and predicting the price direction of the asset for a given period of time. When traders or investors study and understand the concept of trend very well in the crypto market, it helps them to become successful traders which tends to make them obtain profits and avoid losses in their trades. Generally, traders use trend indicators for simple and easy identification of trends in the market. For the purpose of much understanding of trends, I would be using the Eliott Wave Pattern to further explain more about trend trading.
Using the Eliott Wave in understanding Trend Trading
Eliott wave indicator refers to a tool used by traders and investors in identifying trends during trades and also to identify impulse movements within trends by making use of extreme highs and lows of the price movement of an asset. The Eliott wave is made up of two waves which are corrective waves, and Impulsive waves. The corrective wave is also made up of 3 waves i.e wave a,c (impulsive moves), and wave b (corrective move) whilst the Impulsive wave is also made up of 5 micro-waves i.e waves 1,3,5 are impulsive moves, and waves 2,4 are corrective moves.
The Eliott waves formation must obey the following principles on a crypto chart before one can comprehend the use of this indicator very well. These principles or rules include the following;
Wave 2 of the impulsive wave must move or trend below the low point of wave 1 of the impulsive wave
Between the waves 1,3, and 5 of the impulsive wave, wave number 3 must not be the shortest among them.
Wave number 4 must not move or trend beyond the low point of wave number 3 of the impulsive wave.
I know these rules might look confusing so I would illustrate that on a crypto chart below.
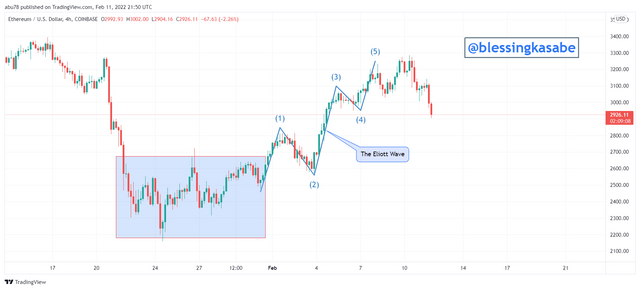
From the chart shown above, we can clearly see that the rules or principles of the Eliott wave were obeyed. We see from the chart that wave 2 did not move or go beyond wave 1 low point. Again, we can obviously see that wave 3 was larger than wave 1 and wave 5. Similarly, we saw that wave 4 did not also move below the low point of wave 3.
We saw that the principles and rules of the Eliott wave were obeyed which move alongside the bullish trend of the asset and when forming the bullish trend, the higher highs and higher lows were maintained.
In this section, I would show how to identify the first and last impulsive waves and also their importance. The first and last impulse is a term given to the corrective phase in the Eliott wave trend or pattern in which the beginning of a trend that is characterized by a break below or above wave a by wave c respectively in a trading market is referred to as the first impulse whilst the end of the corrective that takes place when a high of wave c is broken is termed as the last impulse.
Now, let's look at how to identify these two impulses separately including examples on crypto charts.
How to Identify First Impulse Move
One feature of the first impulse move is the starting of a new wave trend in the asset's price movement and to identify it we first have to look and identify the fifth wave for the previous Eliott wave. After we identify wave 5 from the previous wave we then observe and analyze the line formed from wave b to see if it is higher than the low of wave 5 formed. Moreover, we then observe and analyze the line formed from wave c to see if the line of wave c breaks and closes above the peak of wave a. This indicates that the line is moving higher than the previous lower high and this is what is termed as the first impulsive move.
The first impulse move is taken to be a breakout in the price movement of an asset in the market and therefore changes the trend or pattern of the asset in the opposite direction to that of the previous or current trend. I would illustrate an example in the chart below.
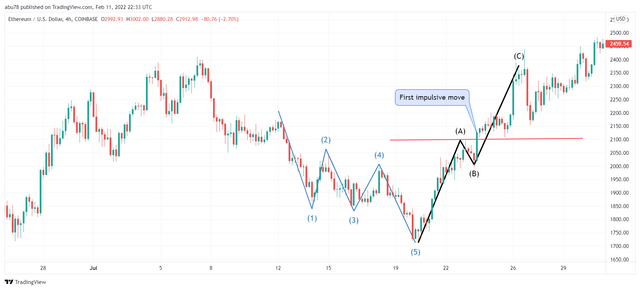
From the ETHUSD Chart shown above, we can clearly see that the first impulse move was created when the price of ETHUSD broke and closed above wave a, i.e. the high of the previous lower high. We saw that after the breakout there was a change in the trend movement of the asset from a bearish trend to a bullish trend.
How to Identify Last Impulse Move
The last impulse is featured by the end of a previous wave trend and to identify it we first have to look and identify wave 5 for the previous Eliott wave. After we identify wave 5 from the previous wave we then observe and analyze the line formed from wave b to see if it is lower than the high of wave 5 formed. Moreover, we then observe and analyze the line formed from wave c to see if the line of wave c will not break and close below the low of wave a. This indicates that the line is moving higher than the previous lower high and that is what is termed as the last impulsive move. I would illustrate an example in the chart below.
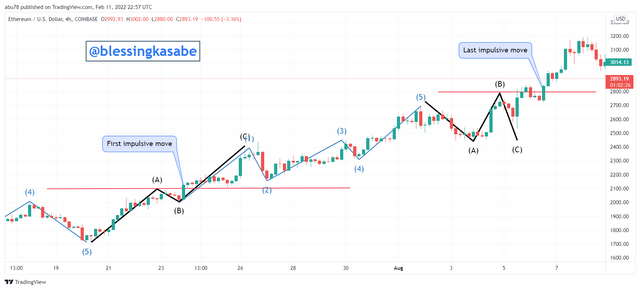
From the ETHUSD Chart shown above, we can clearly see that the last impulse move was created when the price of ETHUSD closed above wave a, i.e. the corrective wave high which indicated a continuation of the bullish trend in the price of the asset as shown above.
In this section, I would be explaining how to identify good points to place buy and sell orders using crypto charts as an example. I would first look at the case of a buy trade opportunity.
How to Identify a good point for Buy trade order Using the Eliott Waves
In identifying a good point for a buy order, the price of the asset must be in an uptrend movement and the following procedures must then be followed. First of all, identify wave 5 of the impulsive wave, and also identify and make sure that wave c is closing above the high point of wave a on the chart. After spotting all these, a parallel line is then drawn from the low point of wave 5 to the low point of wave a and this should be higher low. We then wait for the price of the asset to close above the parallel line drawn and then we execute the buy order where take-profit is placed or targeted with the closest resistance point and stop-loss is placed just below the wave a low. Let's look at an illustration from the chart shown below.
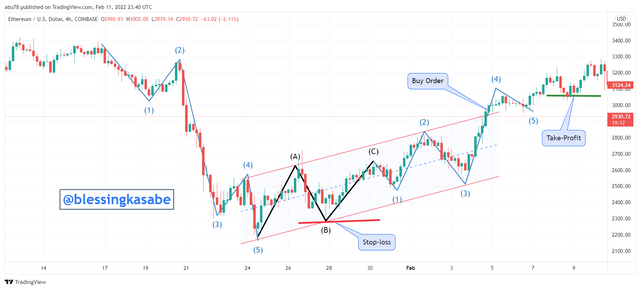
From the ETHUSD Chart shown above, we can clearly see that immediately after the drawn parallel line at the top of the wave was broken we executed the buy order. The buy order placed here is safer and a good point for a trader to enter the trade.
How to Identify a good point for Buy trade order Using the Eliott Waves
In identifying a good point for a sell order, the price of the asset must be in a downtrend movement and the following procedures must then be followed. First of all, identify wave 5 of the impulsive wave. After spotting that, a parallel line is then drawn from the high point of wave 5 to the low point of wave a. We then wait for the price of the asset to close below the parallel line drawn and then we execute the sell order where take-profit is placed or targeted with low of wave a, and stop-loss is placed just above the new resistance formed. Let's look at an illustration from the chart shown below.
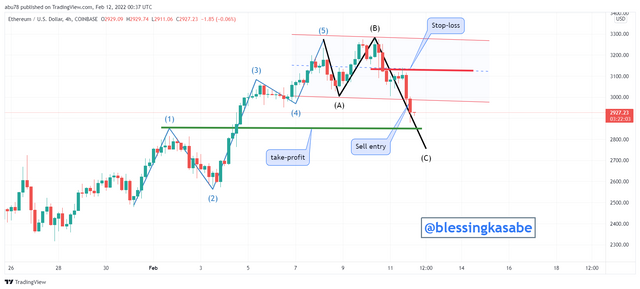
From the ETHUSD Chart shown above, we can clearly see that immediately after the drawn parallel line at the bottom of the wave was broken we executed the sell order. The sell order placed here is safer and a good point for a trader to enter the trade.
In this section, I would be explaining the relationship between the Eliott Wave and the Wyckoff Method.
The Eliott Wave and the Wyckoff Method
The Eliott wave and the Wyckoff method are related such that they both possess similar principles in terms of trend trading. This relationship or similarity in principle they both share is that the corrective wave of the Eliott wave correlates with that of the distribution and accumulation phases of the Wyckoff Method and it is seen at the start of a new trend in the market.
As we explained earlier, the corrective waves of the Eliott wave start at the formation of a new trend when the price of the asset closes above or below the high point or low point of the high or low of wave a. the Eliott waves also correlates with the price action's principles where before a trend reversal can be observed unless there is a violation of a higher high or lower high point.
Conversely, the Wyckoff method also employs the use of the distribution and accumulation phases in order to identify possible trend reversal zone as well as trend continuation in the price of an asset in the market. When the Wyckoff method is utilized with price action, there is an improvement in the accuracy of the future prediction of the trend of the asset.
When the Eliott wave and the Wyckoff method are used together, they produce strong confirmation of trend trading in the market. A good example is shown in the chart shown below.
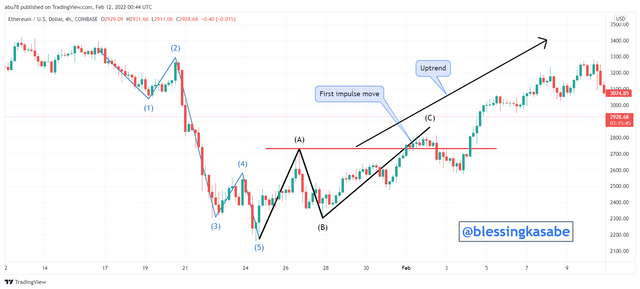
From the ETHUSD Chart shown above, we can clearly see to it that both the Eliott wave and Wyckoff method signaled an indication of a trend reversal in the price of the asset from a bearish trend to a bullish trend. We clearly see that the first impulse move was formed pr created within the region of the accumulation phase indicating a strong confirmation of trend reversal because it also shows that strong hand investors are in control of the market at that time.
Conclusion
To conclude, I would like to briefly summarize what has been done so far in this article. First of all, we explain the concept of trading in the finance sector as well as in the crypto world. We also looked at the different trading analyses used by traders in the crypto market. In addition, we discussed the strong and weak hands in the market by including crypto charts examples.
Furthermore, we explained why a trader must think like a pro is better than thinking like a pack. Again, we discussed the concept and understanding of trend trading where we used examples on crypto charts.
Moreover, we discussed and practiced how to identify the first and last impulse waves in a trend including their importance as well. We then discussed and explained how to identify a good point for a buy or sell order by using crypto charts examples.
Finally, we discussed the relationship existing between the Eliott wave theory and the Wyckoff method with a crypto chart example. I would like to say a very big thank you to professor @nane15 for this wonderful lecture. I have really understood the concept of "Basics to trading cryptocurrencies correctly, Part 1".
Thank You.